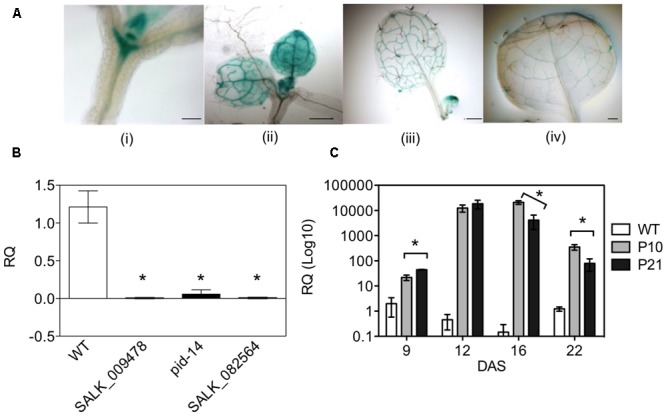
FIGURE 1.

Spatio-temporal expression of PID in Arabidopsis plants. pPID::GUS line with expression in shoot apical meristem and the proliferating leaves at 9 DAS (i, ii); and at 14 and 17 DAS in the expanding leaves (iii, iv) (A). Expression profiling of T-DNA insertion mutants and overexpression lines of PID. SyBr green qPCR assay using the seedlings of pid mutants at 7 DAS (B) and leaves of PID overexpression lines at different time points (C). Asterisks mark the difference between WT and mutants (B). Data are averages ± SE (t-test, P < 0.05); n = 3; Scale bar 100 μm (i) and 500 μm (iii, ii, iv).
