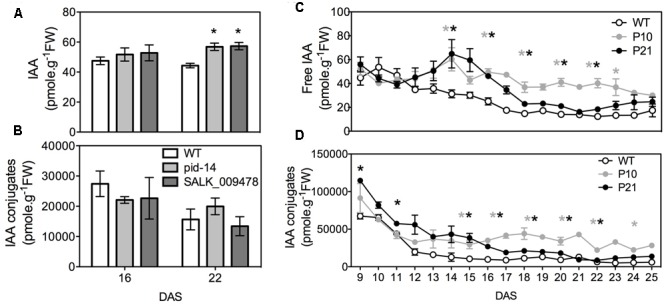
FIGURE 2.

Indole-3-acetic acid (IAA) measurements. Analysis of free (A) and conjugated IAA (B) in wild type and pid mutants. Analysis of free (C) and conjugated IAA (D) in PIDOE, P10 and P21 from proliferating, expanding and mature first pair of leaves. Error bars represent averages ± SE (t-test, P < 0.05). Asterisks mark significant differences between different lines and the wild type (gray: WT vs. P10, black: WT vs. P21 in C,D).
