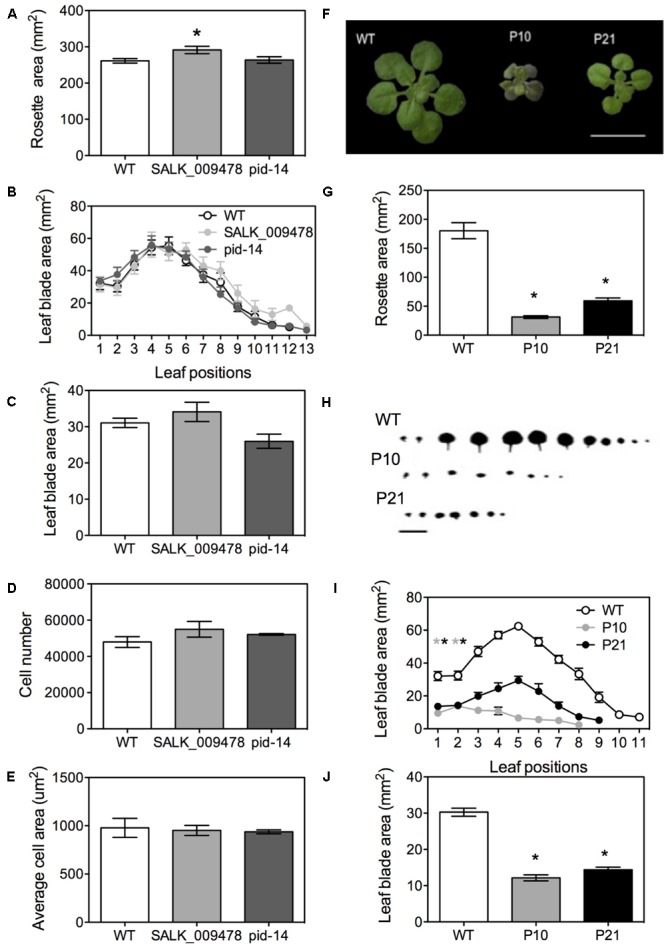
FIGURE 4.

Phenotypes of PID overexpression lines and pid mutants in Arabidopsis. Rosette area of pid knockouts at 22 DAS (A). Leaf series at 25 DAS (B). Leaf blade area in pid knockouts (C). Cell number (D) and average cell area (E) in first pair of leaves in pid knockouts. Figure showing mature rosettes at 22 DAS in WT and PID overexpression lines (F). Rosette area measurements at 22 DAS (G). Leaf series (H) and leaf series measurements at 25 DAS starting from oldest (first L1, L2) to youngest leaves (L9-L11; I). Leaf area measurements for the first leaf pair (J). Asterisks indicate significant differences with the wild type. Error bars represent ± SE (t-test, P < 0.05). Scale bar = 10 mm.
