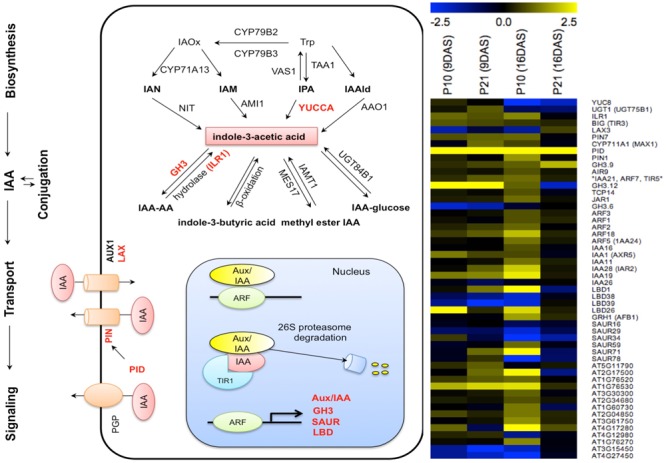
FIGURE 9.

Effect of PID overexpression on the expression of genes involved in various auxin-related pathways. Schematic representation of auxin related pathways, on which affected genes are indicated in red, based on RNA-seq data from both PIDOE lines. Heat map shows auxin-related genes affected by PID overexpression. Abbreviations: Trp, tryptophan; IAOx, indole-3-acetaldoxime; IAN, indole-3-acetonitrile; IPA, indole-3-pyruvate; IAM, indole-3-acetamide; IAAld, indole-3-acetaldehyde. Yellow and blue colors in the heat map represent up- and downregulation of genes, respectively.
