
Fig. 3.
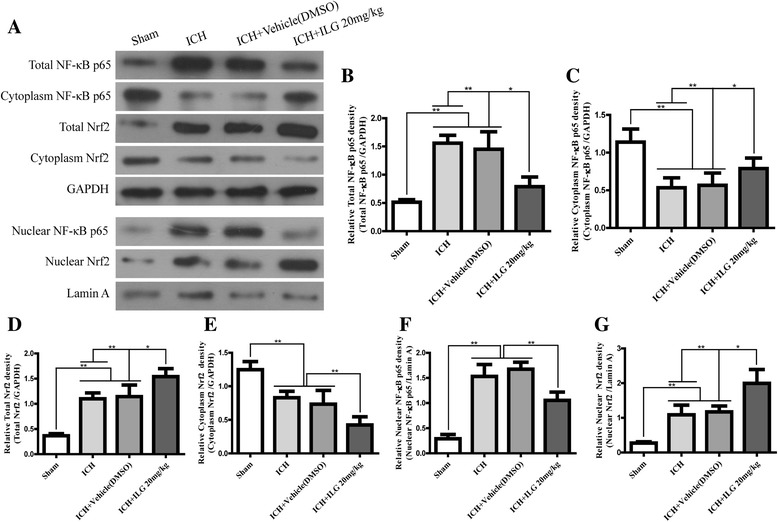
Effects of ILG on protein levels of NF-κB p65 and Nrf2 after ICH. Representative WB bands of NF-κB p65 and Nrf2 proteins (total, cytoplasmic and nuclear) (a) and quantitative analyses of total NF-κB p65 (b), cytoplasmic NF-κB p65 (c), and nuclear NF-κB p65 (f) protein levels and total Nrf2 (d), cytoplasmic Nrf2 (e), and nuclear Nrf2 (g) protein levels (n = 6 rats/group). Values are indicated by means ± SD; **p < 0.01; *p < 0.05