
Fig. 4.
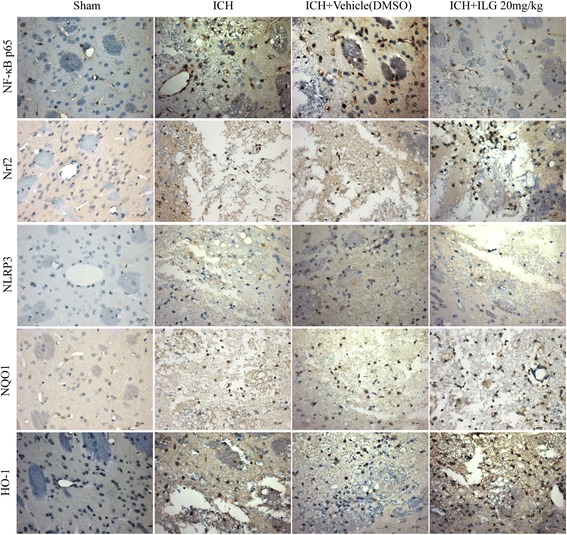
Effects of ILG on protein levels of NF-κB and Nrf2 pathways evaluated by IHC staining. Typical IHC images of NF-κB p65, Nrf2, NLRP3, NQO1, and HO-1 (n = 6 rats/group). Scale bar = 20 μm
Official websites use .gov
A
.gov website belongs to an official
government organization in the United States.
Secure .gov websites use HTTPS
A lock (
) or https:// means you've safely
connected to the .gov website. Share sensitive
information only on official, secure websites.
Effects of ILG on protein levels of NF-κB and Nrf2 pathways evaluated by IHC staining. Typical IHC images of NF-κB p65, Nrf2, NLRP3, NQO1, and HO-1 (n = 6 rats/group). Scale bar = 20 μm