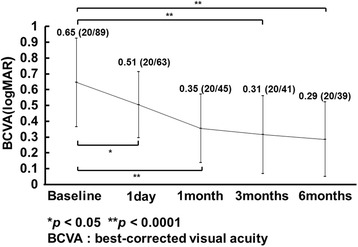
Fig. 1.

The mean changes in the logarithm of the minimum angle of resolution (logMAR) best-corrected visual acuity (BCVA) at each follow-up evaluation (n = 21 eyes). The values are expressed as the mean ± standard deviation (Snellen equivalent). The BCVA is improved significantly from baseline (*p < 0.05, **p < 0.0001)
