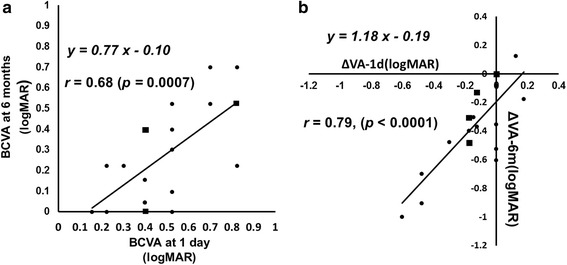
Fig. 2.

a The relationship between the changes in the logarithm of the minimum angle of resolution (logMAR) best-corrected visual acuity (BCVA) 1 day after the first intravitreal ranibizumab (IVR) injection and the BCVA 6 months after the first IVR injection. There is a significant (r = 0.68, p = 0.0007) positive correlation between them. The squares indicate that two eyes overlap. b The relationship between the changes in the logMAR BCVA from baseline to 1 day (ΔVA-1 day) and the changes in the BCVA from baseline to 6 months (ΔVA-6 months) after the IVR injections. There is a significant (r = 0.79, p < 0.0001) positive correlation between them. The squares indicate that two eyes overlap
