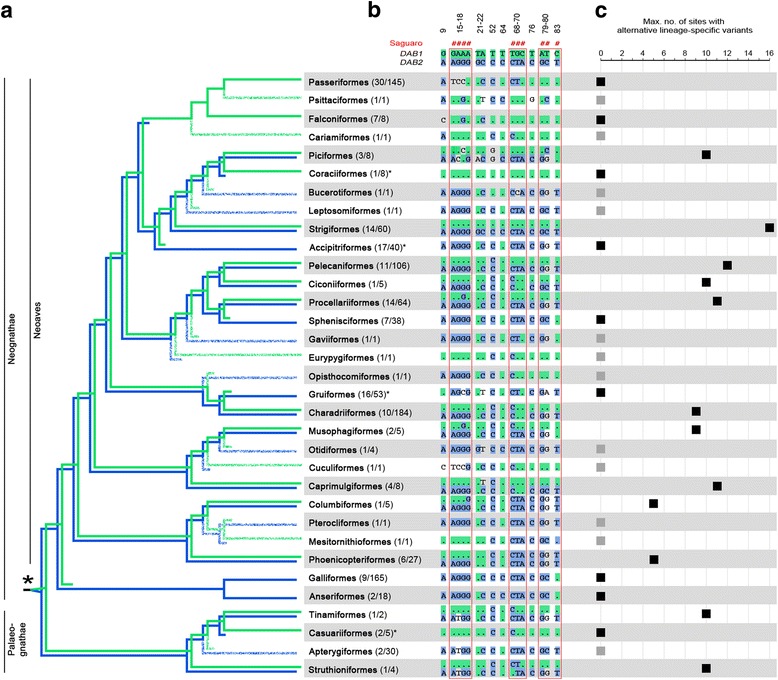
Fig. 1.

a Schematic of the phylogenetic distribution of the avian DAB1 (green) and DAB2 (blue) MHCIIB lineages based on the phylogenetic placing of sequences (Fig. 2, Additional file 1) and on the screening of sequence signatures for DAB1- and DAB2-specific variants (panel b). The duplication event preceding the avian radiation is depicted by an asterisk. In parentheses, the number of species and sequences are provided for each order. Asterisks following parentheses indicate orders for which only one lineage was identified despite efforts to isolate the second lineage [28]. Accordingly, for orders with only a single lineage available on DNA databases obtained with non-significant sequencing efforts, branches are presented in dissolved colors. b Alignment of the 16 lineage-specific sites in exon 3. For each order, the most DAB1-like and the most DAB2-like sequence is presented. Dots in the alignment represent variants identical with the DAB1 sequence signature. Green and blue shading indicate variants identic with the DAB1-specific and DAB2-specific variants, respectively. Sites identified to trace duplication history using Saguaro are highlighted with hashes and red frames. c Degrees of divergence/homogenization of the lineages within avian orders. For each order, the number of pairwise differences between the most DAB1-like and the most DAB2-like sequences within the 16-bp signatures is provided. For orders with only one type of sequence, this number is zero and is indicated in grey where only a single sequence was available (usually from a genome assembly)
