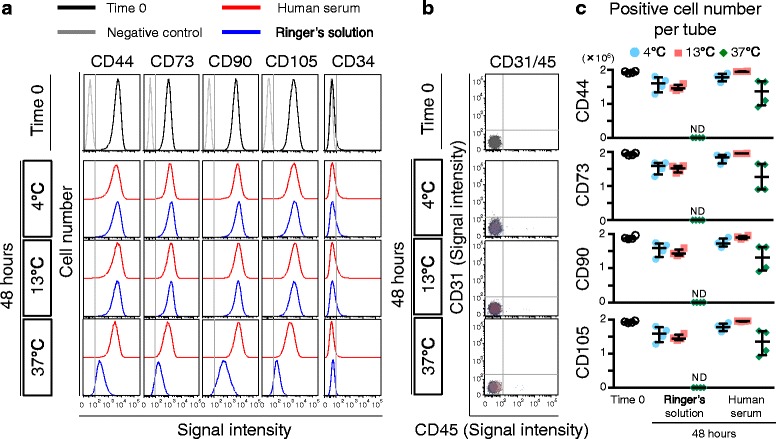
Fig. 5.

Surface markers of synovial MSCs before and 48 h after preservation. a Representative histogram of synovial MSCs by CD44-PE-Cy7, CD73-V450, CD90-PE, CD105-APC, and CD34-PE-Cy5. b Representative dot plot of synovial MSCs by CD31-FITC and CD45-APC-H7 as negative markers. c Calculated live cell number per tube (2 million synovial MSCs). Median values and interquartile ranges are shown (n = 4). ND not detected
