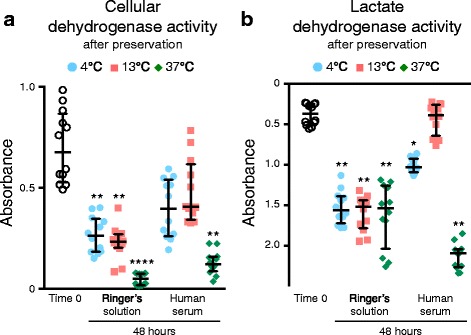
Fig. 6.

Metabolic activity of synovial MSCs before and 48 h after preservation. Passage 2 synovial MSCs before and 48 h after preservation were analyzed by colorimetric assay. a Cellular dehydrogenase activity as live cell metabolic activity. b Lactate dehydrogenase activity as dead cell metabolic activity. Median values and interquartile ranges are shown (n = 4). *p < .05, **p < .01, ****p < .001, compared with the value at Time 0 by Friedman test followed by Dunn’s multiple comparisons
