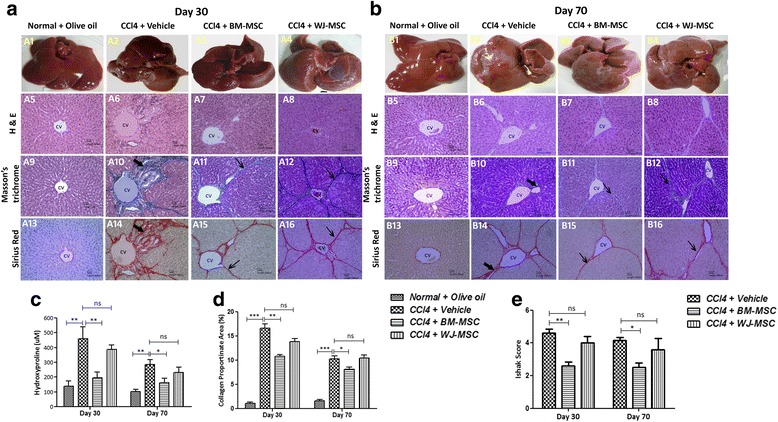
Fig. 6.

Histopathological analysis of liver tissue sections after transplantation of BM-MSCs and WJ-MSCs in CCl4-induced liver fibrosis/cirrhosis. a, b Representative images showing the gross morphology of liver (respective panel numbers 1–4,) and photomicrographs of liver tissue sections stained with hematoxylin and eosin (H&E; respective panel numbers 5–8), Masson’s trichrome (respective panel numbers 9–12), and Sirius red (respective panel numbers 13–16). c Quantitative analysis of hepatic hydroxyproline content on days 30 and 70. d Collagen proportionate area quantification by computer-assisted image analysis on days 30 and 70. e Histopathological analysis of liver sections using Ishak scoring criteria [26]. Thick arrows show thick strands bridging fibrosis; thin arrows show thin strands bridging fibrosis. Scale bars = 100 μm, magnification 10×. ***p < 0.001, **p < 0.01, *p < 0.05. BM-MSCs; bone marrow-derived mesenchymal stromal cells, ns; not significant, WJ-MSCs; Wharton’s jelly-derived mesenchymal stromal cells
