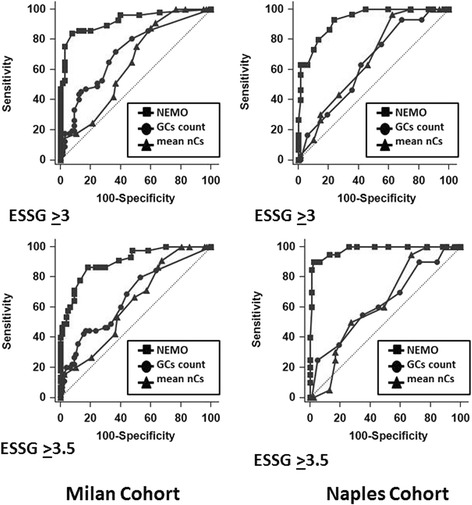
Fig. 2.

ROC curves built by plotting the sensitivity and specificity values of the number of micro-haemorrhages and micro-thromboses (NEMO) score (squares), giant capillary (GC) count (circles), and mean number of capillaries (nCs; triangles) in correctly classifying patients with either European Scleroderma Study Group (ESSG) index scores ≥3 or ≥3.5 are shown for both the Milan (left) and Naples (right) cohorts. In both cohorts, the AUC of the NEMO score was always significantly greater than the AUCs designed by plotting both the GC counts and the mean nCs (p < 0.0001). Conversely, no differences were found when we compared the AUC of the GC and capillary counts of both cohorts
