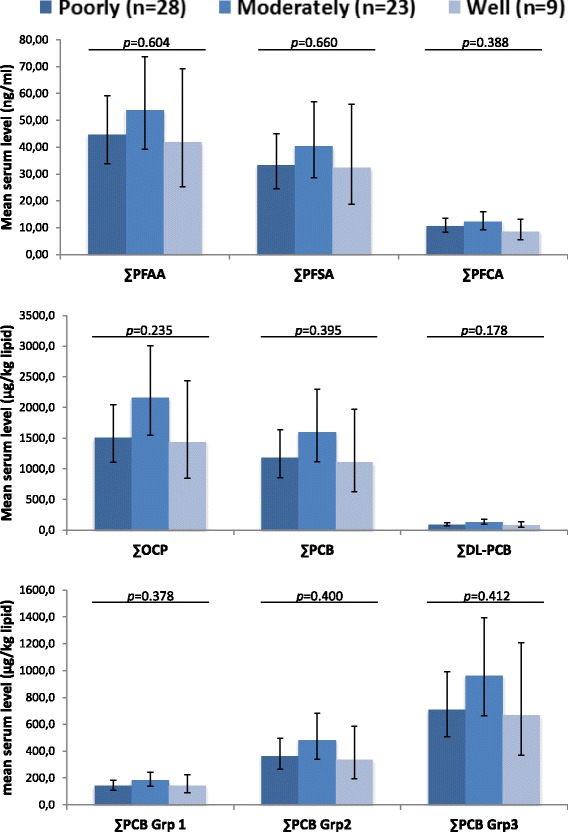
Fig. 2.

Serum levels of lipophilic POPs and PFAA in breast cancer cases with different differentiation grades. Mean serum POP estimates with 95% confidence interval (shown as vertical lines) obtained with ANCOVA analyses with age included as a covariate. The analyses were carried out on ln-transformed exposure variables and estimates were transformed back for the figure. p: p-value of the difference between ER+ and ER- cases; ∑PFCA: PFHpA, PFOA, PFNA, PFDA, PFUnA, PFDoA and PFTrA; ∑PFSA: PFHxS, PFOS and PFOSA; ∑PFAA: ∑PFCA + ∑PFSA; ∑PCB: PCB 99, 101, 105, 118, 128, 138, 153, 156, 170, 180, 183, 187; ∑DL-PCBs (dioxin-like PCBs): PCB 105, 118, 156; ∑OCP: p,p′-DDT, p,p′-DDE, mirex, β-HCH, HCB, cis- and trans-nonachlor, and oxychlordane; ∑PCB group 1 (estrogenic PCBs): PCB 101, 187; ∑PCB group 2 (anti-estrogenic and dioxin-like PCBs): PCB 105, 118, 128, 138, 156, 170; ∑PCB group 3 (CYP1A1 and CYP2B inducing PCBs): PCB 99, 153, 180, 183
