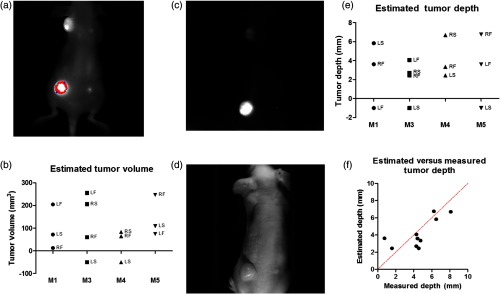
Fig. 3.
(a) Representative gradient-based tumor volume algorithm NIR fluorescence images showing the tumor outline used to estimate the tumor volume. (b) Estimated tumor volume by mouse and tumor (M2 was not injected with the fluorescent probe). A total of 4 mice and 13 tumors were analyzed, 11 tumors returned results. Tumor locations are indicated by LF, LS, RF, and RS. (c) Fluorescence image used for the fluorescence–reflectance depth imaging analysis. (d) Reflectance image used for the fluorescence–reflectance depth imaging analysis. (e) Depth estimates using the fluorescence–reflectance method by mouse and by tumor. A total of 4 mice and 13 tumors were analyzed, 10 tumors returned results. (f) Estimated versus measured depth for each of the tumors where a depth estimate was successfully obtained.

