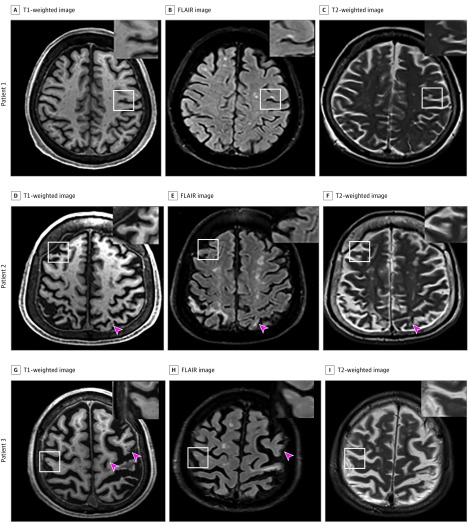
Figure. Varying Numbers of Cortical Cerebral Microinfarcts (CMIs) on 3-T Magnetic Resonance Imaging in Different Patients.
A representative cortical CMI, which was first explored on a 3-dimensional T1-weighted image (A, D, G) and further confirmed on fluid-attenuated inversion recovery (FLAIR) (B, E, H) and T2-weighted (C, F, I) images. White boxes indicate area with CMIs as shown in the magnified view in insets; red arrowheads, additional CMIs other than the one shown in white boxes.

