
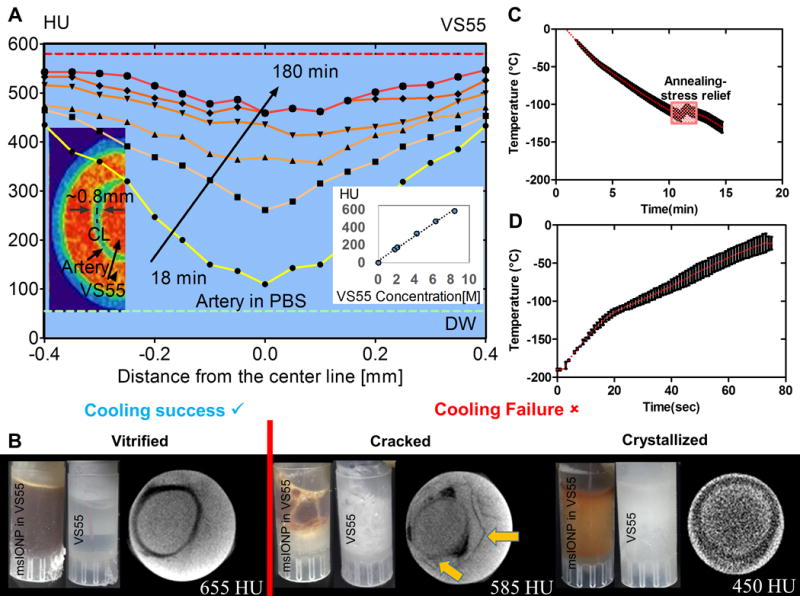
Fig. 3. VS55 loading, vitrification, and nanowarming of porcine arteries.
(A) Quantitation and distribution of VS55 loading over time in the wall of one out of three representative porcine arteries imaged in (B). The corresponding pseudocolor image shows green artery wall and red VS55 solution by μCT. The red dashed line represents the fully loaded HU. The green dashed line represents artery in PBS HU (n=3 for calibration curve). (B) Photographs and computed tomography images of three separate arteries in 1 mL vials demonstrating successful artery vitrification (left), failure due to cracking (middle), and failure due to crystallization (right). The density differences due to the cracking are noted by arrows in B. (C) Graph of temperature over time for convective cooling vitrification of arteries in 1 mL vials at 15 °C/min > CCR of VS55. (D) Graph of temperature over time for nanowarming at 20 kA/m and 360 kHz of the same arteries in (C) loaded with msIONP in VS55 in 1 mL vials. Nanowarming reached 130 °C/min which is > CWR of VS55.