
Fig. 5. Nanowarming maintains viability of porcine carotid in 1 to 50 mL systems.
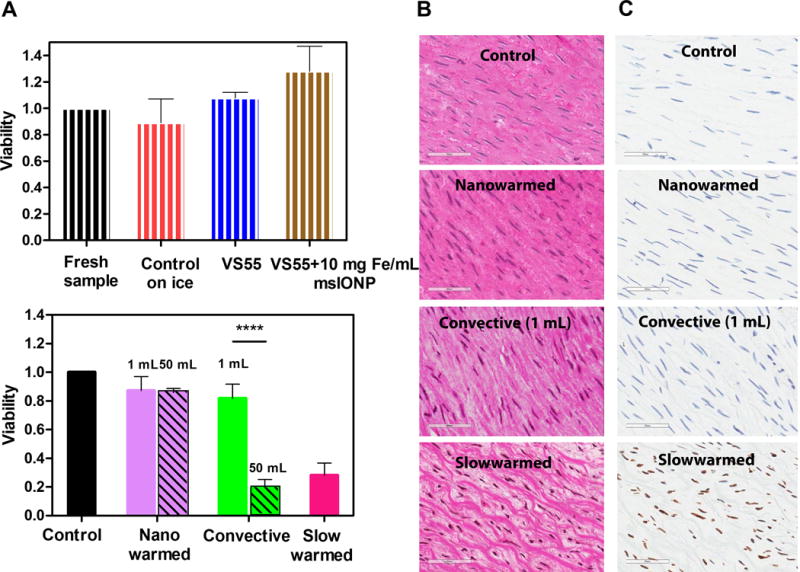
(A) Viability of porcine carotid artery normalized to the control (fresh tissue in growth media) as measured by alamarBlue assay and TUNEL stain. The upper plot shows the cytotoxicity effect of adding VS55 and 10 mg Fe/mL msIONP to the artery (n = 4 − 7). The striped bars represent viability of fresh samples normalized to control (black control = 100%), samples that were maintained on ice for the same period of time (1 − 2 h) (red, 89 ± 2%), samples that were exposed to VS55 (blue, 100 ± 1.4%) or VS55 and 10 mg Fe/mL msIONP (brown, 128 ± 19%). The bottom plot shows the artery viabilities after nanowarming (solid purple, 1 mL: 87 ± 10%, patterned purple, 50 mL: 86 ± 3%), fast convective heating (solid green, 1 mL: 82 ± 10%, patterned green, 50 mL: 20 ± 6%) and slow warming (pink, 1 mL: 28 ± 9%). In 1 mL, the nanowarmed sample viability is comparable to the fresh control and slow warmed sample showed a decline of viability compared to fresh control (P < 0.0001). In 50 mL, the nanowarmed sample viability is slightly lower than the fresh control (P = 0.0275) but comparable to nanowarmed sample in 1 mL (P = 0.9996). The fast convective warmed sample viability is significantly reduced in 50 mL (P < 0.0001). The statistical analyses of multiple comparisons of other possible conditions are included in table S4. N = 3 − 6 for both 1 mL and 50 mL systems; n = 4 − 7 in 1 mL system; n= 3 − 5 in 50 mL. N = number of pigs; n = number of arteries (B) Histological images of H&E stained control, nanowarmed, convective (1 mL), and slow warmed arteries. Scale bar is 60 μm. Normalized tissue white space compared to control: 2 ± 0.3%, P = 0.09 for nanowarmed samples, 31 ± 1%, P < 0.0001 for slow warmed convective samples. See also fig. S3. (C) TUNEL stained images corresponding to the same histology samples in B. All data is presented as the mean ± standard deviation.