
Fig. 6. Nanoparticle washout from porcine carotid arteries.
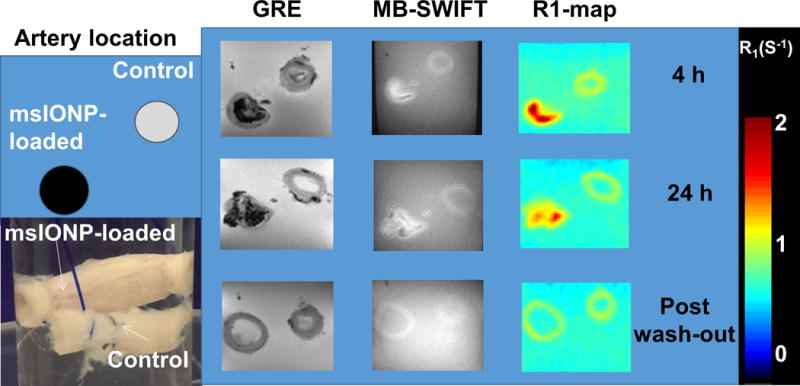
Schematic and photograph of arteries loaded with 1.0 mg Fe/mL of msIONP compared to control (no msIONPs) in VS55 at room temperature during loading and washout (N = 2, n = 2). GRE and SWIFT MR images were acquired and the R1 map was generated from the SWIFT data. The color bar indicates the R1 in 1/s. Images were taken at 4 and 24 h after msIONP loading and post washout.