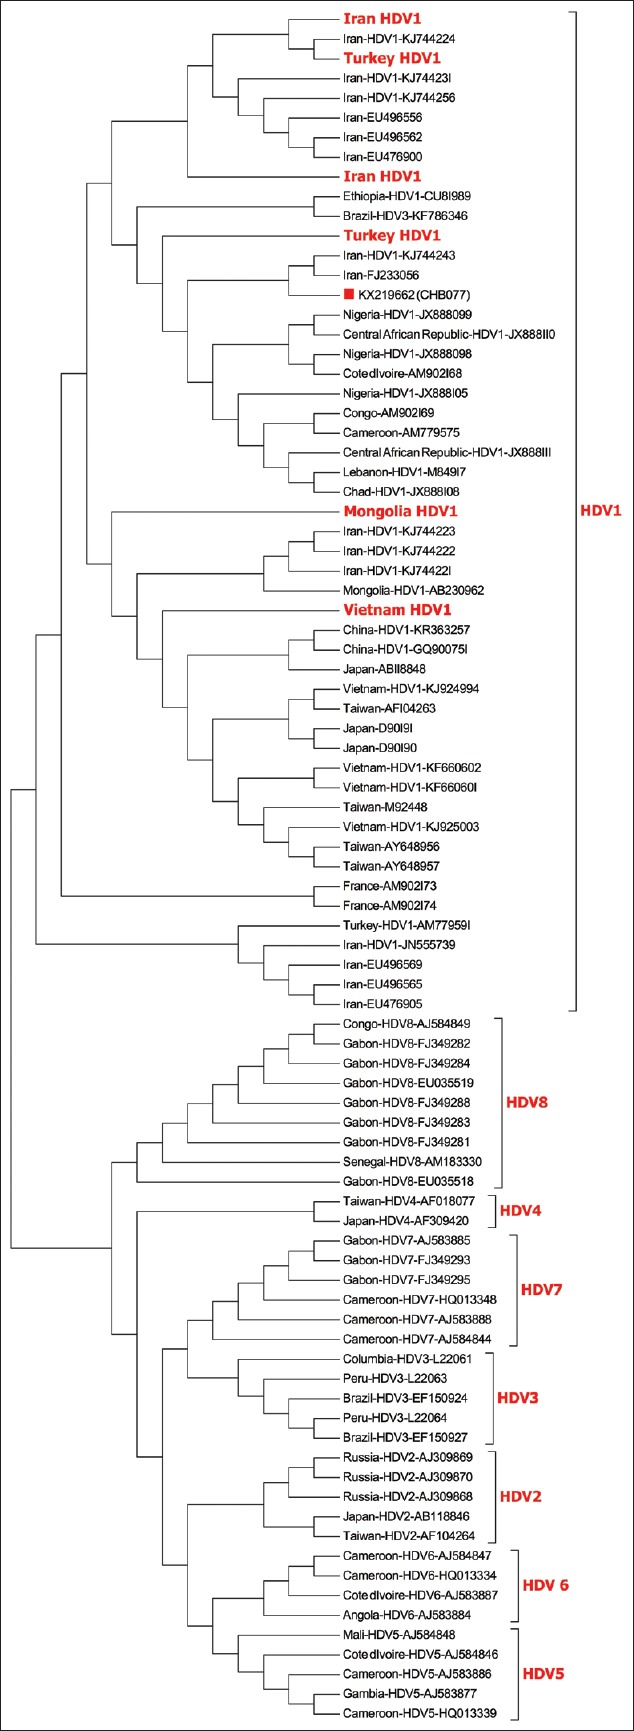
Figure 2.

Phylogenetic tree of the positive HDV sample from this study represented by a red square. Bold face red font taxa represent isolates originating from the same country collapsed to save space. The evolutionary history was inferred using the Neighbor-Joining method. The bootstrap consensus tree inferred from 1000 replicates is taken to represent the evolutionary history of the taxa analyzed. Branches corresponding to partitions reproduced in less than 50% bootstrap replicates are collapsed. The percentage of replicate trees in which the associated taxa clustered together in the bootstrap test (1000 replicates) are shown next to the branches. The evolutionary distances were computed using the Maximum Composite Likelihood method and are in the units of the number of base substitutions per site
