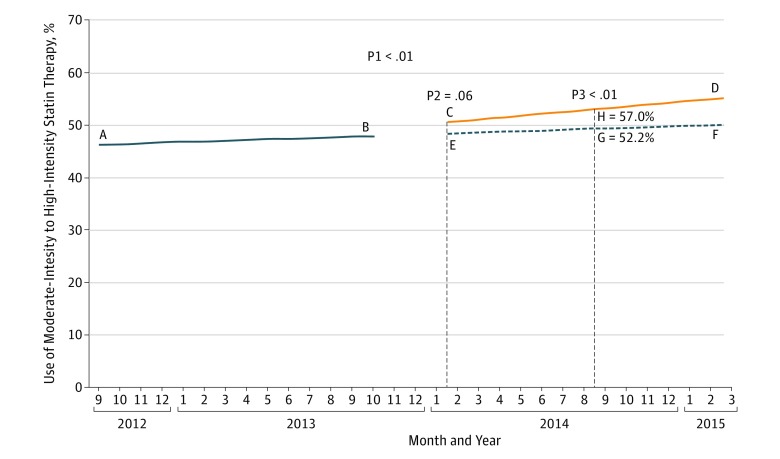
Figure 4. Model Estimated Use of Moderate-Intensity to High-Intensity Statin Therapy in the Overall Cohort.
Line A to B, Moderate-intensity to high-intensity statin use for the preguideline period. Line C to D, Moderate-intensity to high-intensity statin use for the postguideline period. Line E to F, Projected moderate-intensity to high-intensity statin use for the postguideline period using preguideline data. G, Estimated moderate-intensity to high-intensity statin use at the middle of the postguideline period (ie, September 2014) using preguideline data. H, Estimated moderate-intensity to high-intensity statin use at the middle of the postguideline period (ie, September 2014) using postguideline data. P1 is the P value for difference in the rate of use of statin therapy between the preguideline and postguideline periods (ie, difference in slope). P2 is the P value for difference in the rate of use of statin therapy at the starting point of the postguideline period (ie, February 2014) (ie, difference in intercept). P3 is the P value for difference in the rate of use of statin therapy at the middle of the postguideline period (ie, September 2014) using preguideline vs postguideline data. Line E to F is dashed to show that it is based on projection of preguideline data. The first vertical dashed line indicates the beginning of the preguideline period, and the second vertical dashed line indicates the middle of the postguideline period.

