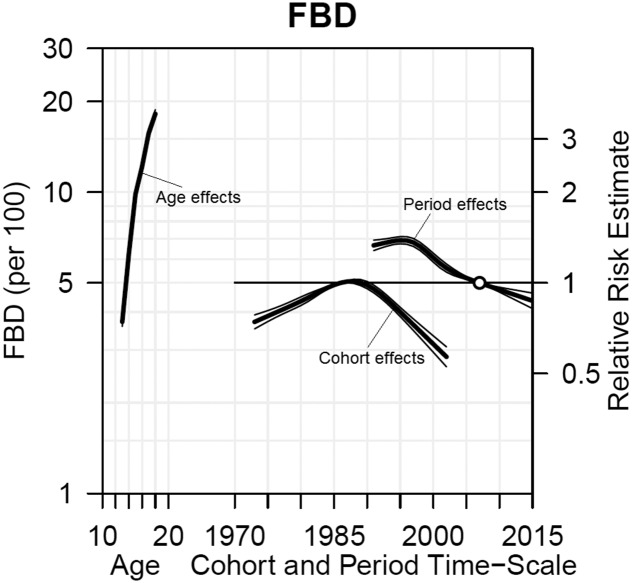
FIGURE 2.
Age, period, and cohort effects on the probability of adolescents reporting FBD from 1991 to 2015 (N = 1 065 022).
The cohort and period time scale contains relative risk estimates for the effect of cohort (left line) and period (right line). Thin lines indicate 95% confidence intervals. The cohort estimates are compared with a referent cohort, 1986; thus, the lines can be interpreted as the average proportion of US students’ FBD, regardless of time period, compared with the average proportion in 1986. The period estimates are compared with a referent period of 2007, and thus the lines can be interpreted as the average proportion of US students’ FBD in that year, regardless of cohort, compared with the average proportion in 2007.

