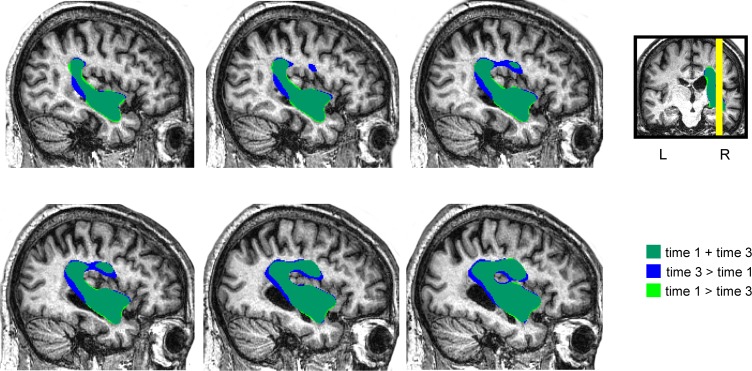
FIGURE 3.
Depiction of the patient’s lesion mask in the time point 1 (BL) and in the time point 3 (DP + T) over the patient’s normalized sagittal T1-weighted image. The lesion mask drawn of the initial MRI (16 months post-stroke onset) was larger in the third MRI (28 weeks after study entry) due to expansion of its subinsular component. The observed lesion expansion probably resulted from retraction of cortical tissues due to focal temporal-parietal post-stroke atrophy (see Figure 2).

