
Fig. 6.
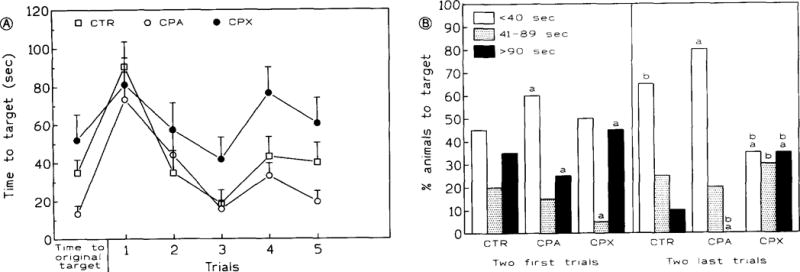
Target latencies (A) and performance (B) to a visible target placed again in the NW quadrant. This phase (starting with trial 1) was the last in a series consisting of the target acquisition phase (nine trials to an invisible target in NW quadrant) and target reversal phase (five trials to an invisible target in SE quadrant with a random starting position. ‘Time to original target’ (fig. 6A, abscissa) indicates target latencies attained at the last trial of the reversal phase in which the invisible target was placed in the opposite (SE) quadrant. There are significant main effects of drug treatment [F(2,26)= 5.921, P< 0.008] and trials effect [F(4,104)= 10.156, P< 0.0001] in 6A. No interation was observed between drug treatment and training trials (P > 0.5). Bars: S.E.M. Statistical significance in fig. B: a P < 0.05 within the trial group; b P < 0.05 between both trial groups. Fisher’s exact test. In both A and B, drugs (CPA: 20 μg/kg, CPX: 1 mg/kg) and vehicle administered for 9 days prior to and then concurrently with training. Bars: S.E.M.