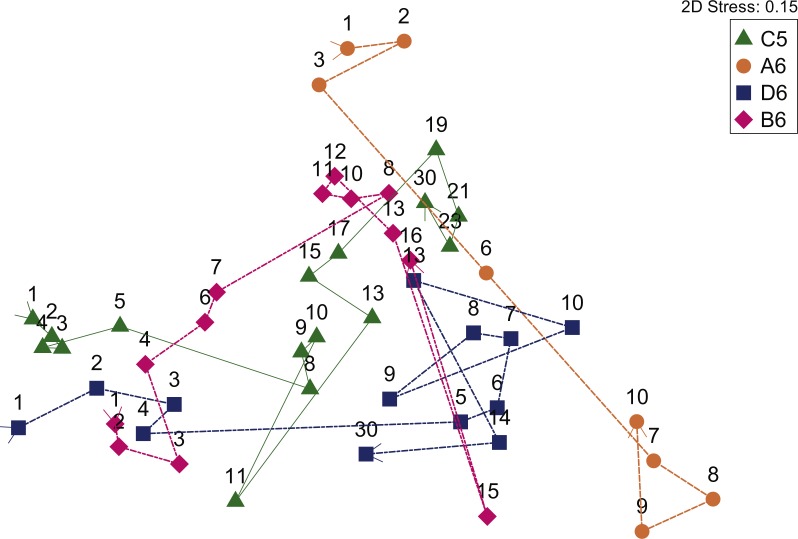
Figure 1. NMDS of Bray–Curtis distances revealed the changes in deceased human subjects gut bacterial communities over time.
Symbols represent the three individuals: A6 (circles), B6 (diamonds), C5 (triangles), D6 (squares) and numbers refer to the day postmortem. The lines indicate the trajectory of the communities starting from the first day postmortem.

