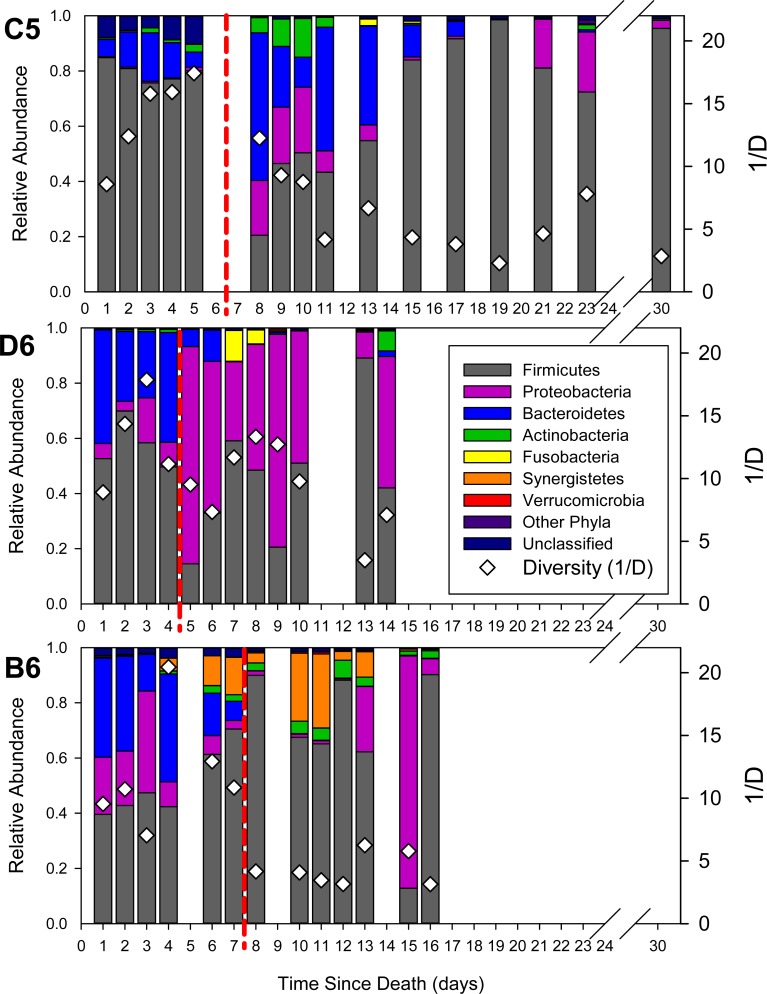
Figure 2. Relative abundance of phyla in the bacterial communities as a function of time since death (postmortem interval).
Red dashed lines differentiate the ‘early’ from the ‘late’ communities as determined by hierarchical cluster analysis. White diamonds show the community diversity, as estimated by the inverse Simpson’s Index (1/D).

