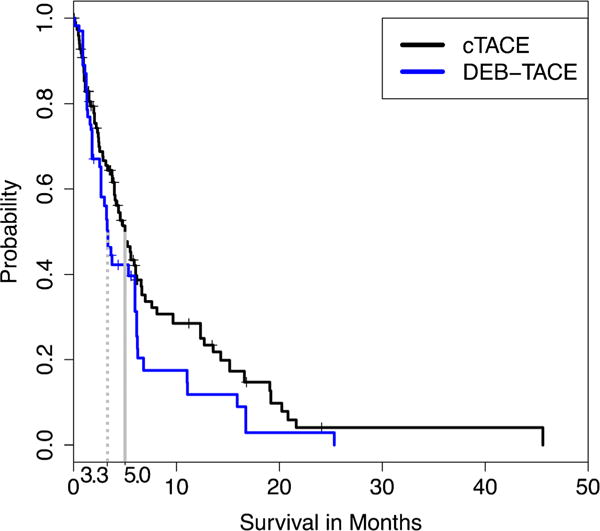
Fig. 2.

Kaplan-Meier curves demonstrating survival after propensity score weighting. The propensity score model has used the covariates defined by BCLC. Survival was defined as the time from the date of TACE to the date of death from any cause. Patients who were lost to follow-up or received another therapy (such as liver transplantation or sorafenib) were censored. BCLC, Barcelona Clinic Liver Cancer; cTACE, conventional transarterial chemoembolization; DEB-TACE, drug-eluting beads TACE
