
Figure 3. Global Impact of Autophagy Impairment on Basal Degradation Rates.
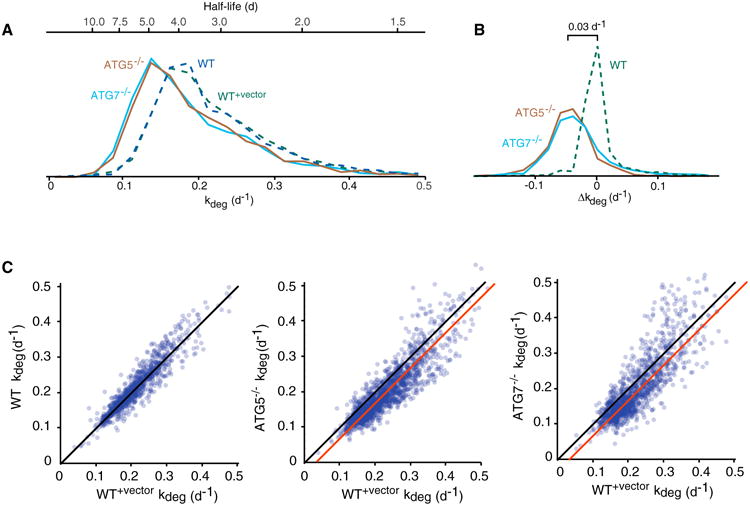
(A) Distribution of protein half-lives and degradation rates in WT, WT+vector, ATG5−/−, and ATG7−/− cells.
(B)Distribution of differences in degradation rates (Δkdeg) between WT+vector cells, and ATG5−/−, ATG7−/−, and WT cells.
(C) Pairwise comparisons of protein degradation rates in WT, WT+vector, ATG5−/−, and ATG7−/− cells. Black lines indicate identity lines, and red lines indicate best-fit lines to the proteome-wide data.