
Figure 6. The Differential Impact of Autophagy Inhibition on Long-Lived and Short-Lived Proteins.
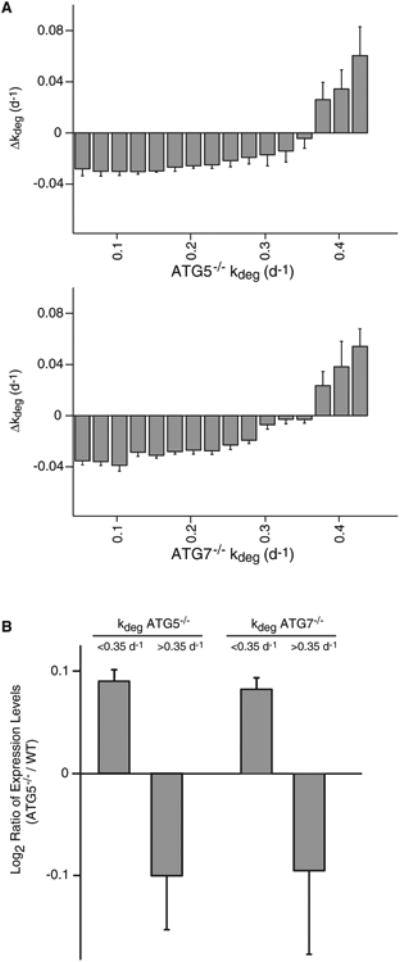
(A) The average Δkdeg for subsets of proteins with varying degradation rates in ATG5−/− and ATG7−/− cells. The trend is consistent with the idea that the change in degradation rates of long-lived proteins is primarily due to reduced flux through the autophagy pathway whereas short-lived proteins may be de-stabilized due to increased proteasome levels. Bars indicate the mean of Δkdeg measurements for subsets of proteins with the indicated range of kdeg values, and error bars indicate SEM.
(B) Steady-state SILAC analysis indicates that, as a group, relative expression levels of long-lived proteins are increased and relative expression levels of short-lived proteins are decreased in ATG5−/− and ATG7−/− cells. Bars indicate the mean of the log2 ratio of expression levels between ATG5−/− and WT+vector cells for subsets of proteins with the indicated range of kdeg values, and error bars indicate SEM.