
Figure 1.
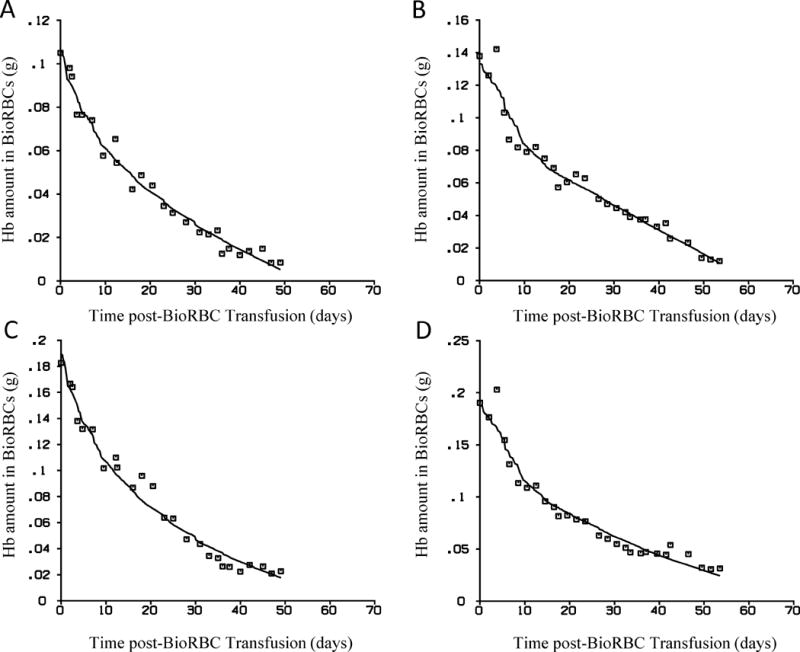
Model fit to Hb amount vs. time data. Panel A and B depict the fit (solid line) of the non-SS neonatal RBC survival model (Equation 4) to the empirical Hb amount circulating in autologous neonatal BioRBCs (open squares) for two representative study subjects. Panels C and D depict the fit (solid line) of the steady-state adult RBC survival model (Equation 1) to the empirical Hb in circulating allogeneic adult donor BioRBCs (open squares) for the same two subjects. Agreement is good between the model fits and the Hb amounts in circulation for each population of RBC (adult and infant) for both subjects.