Figure 1.
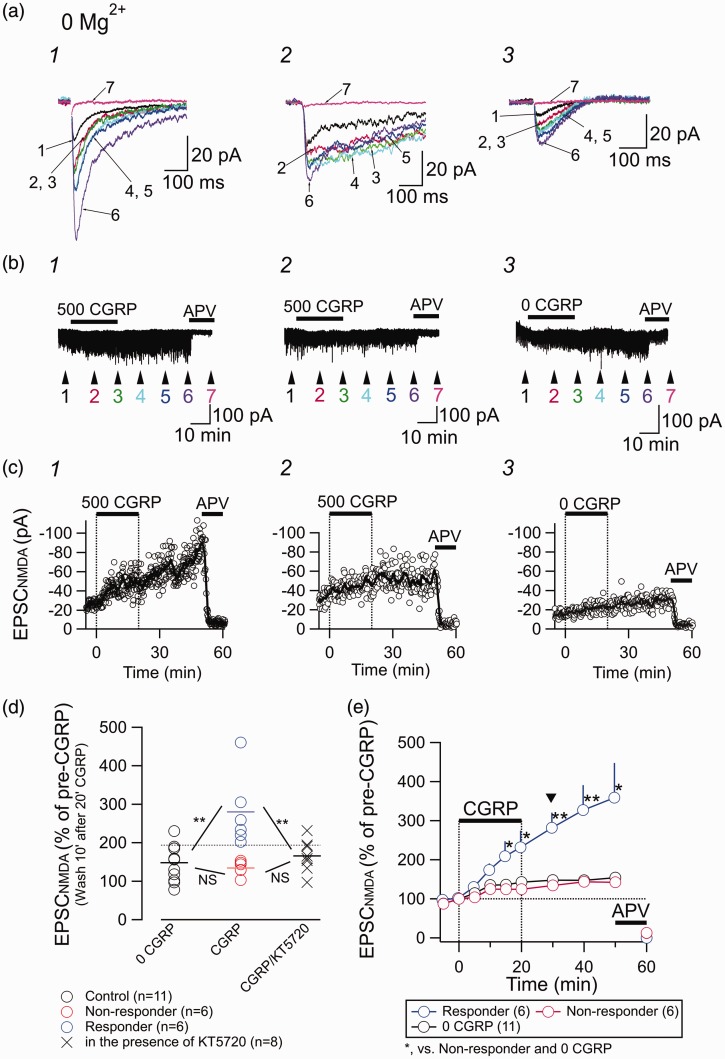
Effect of CGRP on the postsynaptic NMDA-R-mediated current. (a) Representative traces showing EPSCNMDA waveforms evoked by LPB pathway stimulation recorded in the absence of Mg2+, in the presence of CNQX, and at a holding potential of −60 mV. Traces with numbers 1–7 are the averaged waveforms of 20 consecutive responses sampled at the time points 1–7 indicated in (b). 1, responder; 2, non-responder; 3, recordings from a neuron to which no CGRP was applied. (b) Representative recordings of the membrane current in CeC neurons. Numbers 1–7 show the time points for the averaged waveforms in (a). Drugs (CGRP (500 nM for 1 and 2; 0 nM for 3) and APV (50 µM)) were bath-applied for the indicated times (horizontal bars). Stimulation artifacts and pre-pulse are removed. (c) Representative examples of the time course of the EPSCNMDA amplitude (open circles, the amplitude of each EPSCNMDA; thick curves, moving average over nine consecutive responses). (d) Changes in the EPSCNMDA amplitude at 10 min after the cessation of the 20-min application of CGRP. “0 CGRP,” continued application of ACSF not containing CGRP; “CGRP,” application of 500 nM CGRP (at the 10-min washout after 20-min application); “CGRP/KT5720”, application of 500 nM CGRP in the sustained presence of 1 µM KT5720. The horizontal dotted lined shows the upper 99% confidence limit of the responses of 11 neurons receiving no CGRP (black open circles). The neurons showing larger responses than this limit were classified as “responders to CGRP.” ** P < 0.01; one-way ANOVA with post hoc Gabriel test. (e) Summary of the time course of the EPSCNMDA amplitude. CGRP (0 or 500 nM) and APV (50 µM) were applied at the horizontal bars. Arrowhead indicates the time point for the value measurement used in panel (d). *P < 0.05, **P < 0.01; Mann–Whitney U test (CGRP (500 nM) was compared with control (“0 CGRP”)). Error bars represent mean ± SEM.

