Figure 3.
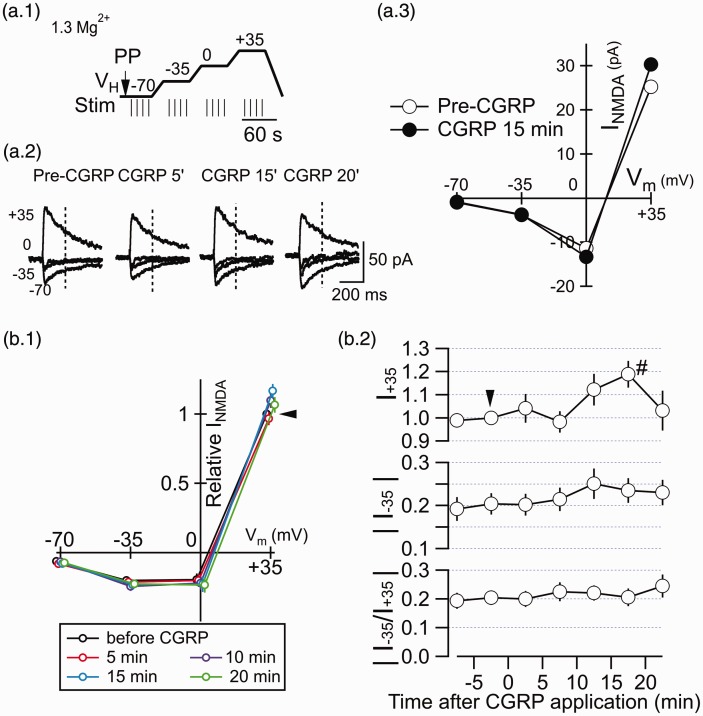
CGRP has little effect on the membrane potential-dependence of the EPSCNMDA. (a.1) Schema showing the voltage-clamp command protocol used to analyze the holding potential-dependency of the EPSCNMDA (see the Materials and methods section for details). The LPB fibers were stimulated four times at each of the voltage steps (short vertical bars at 10-s intervals). The responses to the four stimuli at each voltage step were averaged. PP, pre-pulse application, with which changes in series resistance was monitored. Each episode composed of voltage steps and stimulations took 280 s and repeated every 5 min to obtain averaged EPSCNMDA waveforms at 5-min interval (as shown in Figure 3(a.2)). (a.2) Traces showing EPSCNMDA waveforms (average of four consecutive traces) evoked by LPB pathway stimulation at −70, −35, 0, and +35 mV holding potentials using the protocol in Figure 3(a.1). “Pre-CGRP,” before application of CGRP; “CGRP 5',” “CGRP15',” and “CGRP 20',” indicate those at 5, 15, and 20 min after the initiation of CGRP application (500 nM), respectively. (a.3) Current–voltage relation of the EPSCNMDA at pre-CGRP (open circles) and 15 min after CGRP (500 nM; filled circles). The amplitude of the EPSCNMDA current was measured 200 ms after the stimulation (vertical dashed line in (a.2)). (b.1) The EPSCNMDA amplitude–voltage relation at before CGRP, CGRP 5 min, 10 min, 15 min, and 20 min. The EPSCNMDA amplitude was measured 200 ms after the stimulation. The black arrowhead shows the relative EPSCNMDA current at +35 mV before CGRP application with which all other amplitudes are normalized. (b.2) The time course of the EPSCNMDA amplitude (top, measured at a VH of +35 mV (relative to the EPSCNMDA amplitude at a VH of +35 mV at pre-CGRP); middle, that at −35 mV; bottom, the absolute value of the ratio of the EPSCNMDA amplitude at −35 mV to that at +35 mV). CGRP (500 nM) was applied from around 0 min for 20 min (note that the timing for obtaining EPSCNMDAs for distinct holding potentials deviates from the time shown in Figure 3(b.2) by ∼2 min at the maximum due to the sequential sampling of the data; Figure 3(a.1)). The EPSCNMDA was recorded with “standard Mg ACSF” containing 1.3 mM Mg2+. The black arrowhead shows the relative EPSCNMDA current at +35 mV before CGRP application with which all other amplitudes are normalized. #P < 0.05 vs. before CGRP; Mann–Whitney U test. Error bars represent mean ± SEM. n = 10 neurons.

