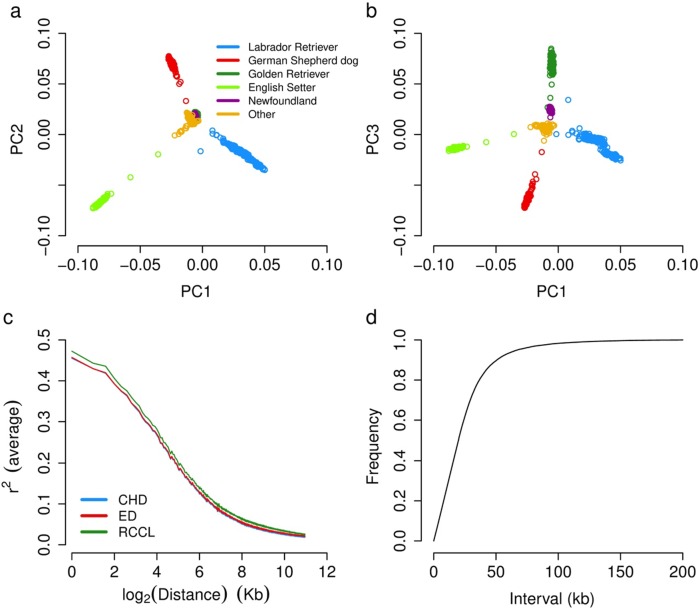
Fig 1. The summary of genetic relationships among the breeds with the most individuals and the decay of linkage disequilibrium (LD).
Along the top three principal components of variation, the main breeds are genetically distinct (a, b). The extent of LD, measured as average pair-wise r2, drops below 0.3 at 11 kb in multiple populations (c). The marker density plot shows the distribution of marker intervals and 80% of marker intervals are less than 30 kb (d). The genotype data used for principal component calculation and genetic relationship building comes from the biggest dataset for HD [11].

