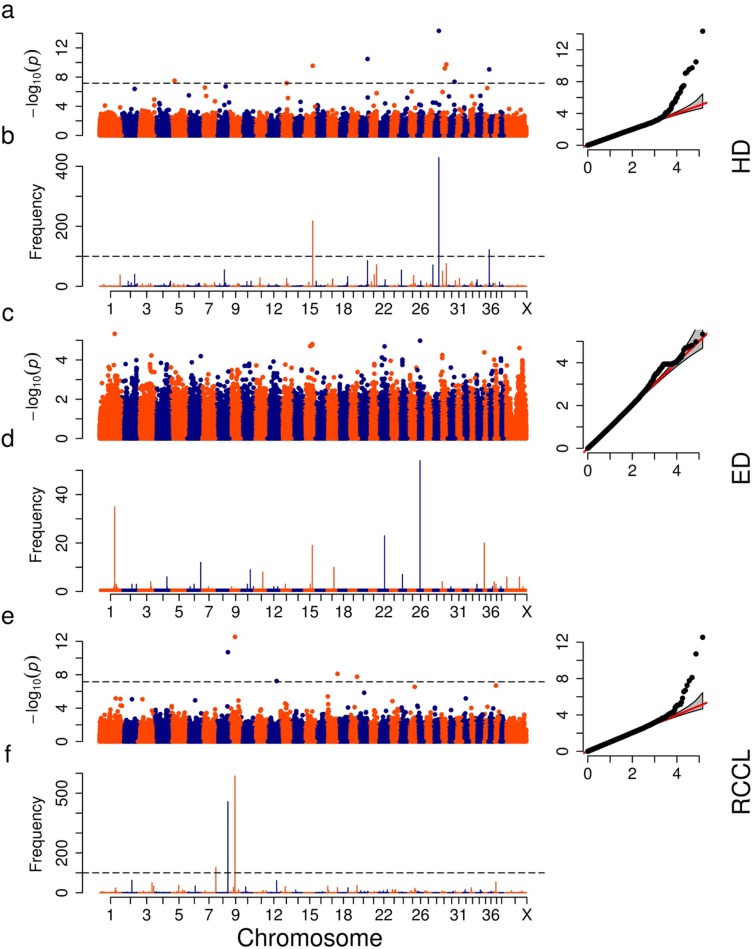
Fig 2.
Manhattan plots, QQ plots and resampling test plots of GWAS for hip dysplasia (HD), elbow dysplasia (ED) and rupture of the cranial cruciate ligament (RCCL) (a, c and e). The dashed horizontal line depicts the Bonferroni-adjusted significance threshold (genome wide α level of 0.01). The QQ plot of association with the null distribution (expected) versus the observed associations is shown as insert. The Manhattan plot of the resampling test (b, d, and f) shows the y axis indicating the number of significant occurrences or associations [expressed as the–log(p)] in 1,000 replicated tests across the genome. Note the scale along the Y axis for the associated–log(p) value varies by plot.

