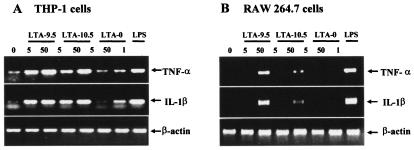
FIG. 6.
Effect of LTA-9.5, LTA-10.5, LTA-0, or LPS treatment on TNF-α and IL-1β mRNA levels in human THP-1 (A) and murine RAW 264.7 (B) macrophage cell lines at 3 h after the treatment. The stimulant doses (in micrograms per milliliter) are indicated below the bar indicating the stimulant. As an internal standard, the β-actin mRNA level was determined.

