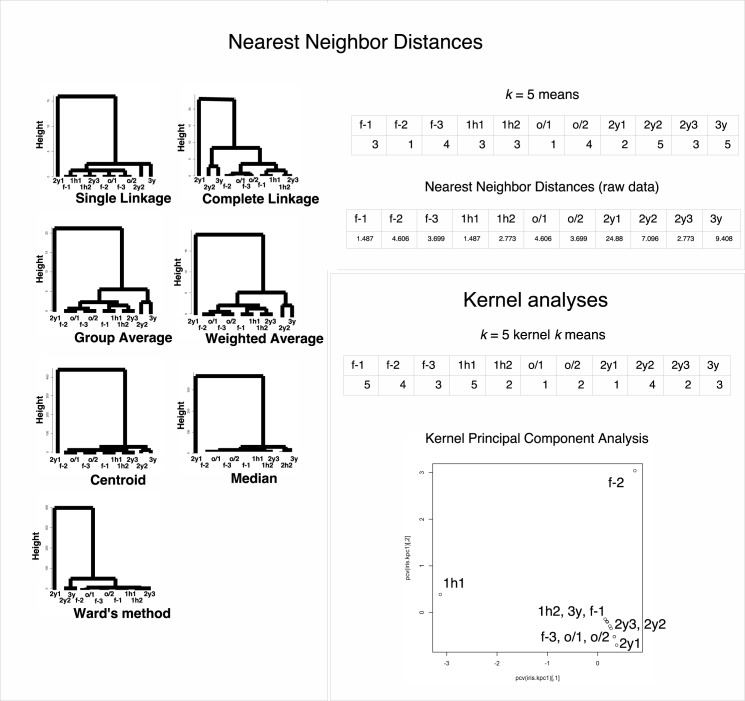
Fig 4. Clustering of nearest neighbor distance value sets and radial basis kernel value sets for each protein in the LC/MS data of HEK-293 (N = 803).
f-1, f-2, and f-3: freshly prepared samples in replicates 1, 2, and 3, respectively; 1h1 and 1h2: samples frozen at −80°C for 1 h in replicates 1 and 2, respectively; o/1 and o/2: samples that remained at −80°C overnight and then in liquid nitrogen overnight (“o/n-o/n”) in replicates 1 and 2, respectively; 2y1, 2y2, and 2y3: samples preserved in liquid nitrogen storage according to the RIKEN protocol for approximately 2 years in replicates 1, 2, and 3, respectively; 3y: sample preserved in liquid nitrogen storage according to the RIKEN protocol for approximately three years. The numbers in the k-means table are the indices of the classified groups. The numbers in the neural network table are the cl factors, which represents the one-dimensional characteristics of the systems. The differences in cl values show dissimilarity of the samples. Please also see the Methods section.

