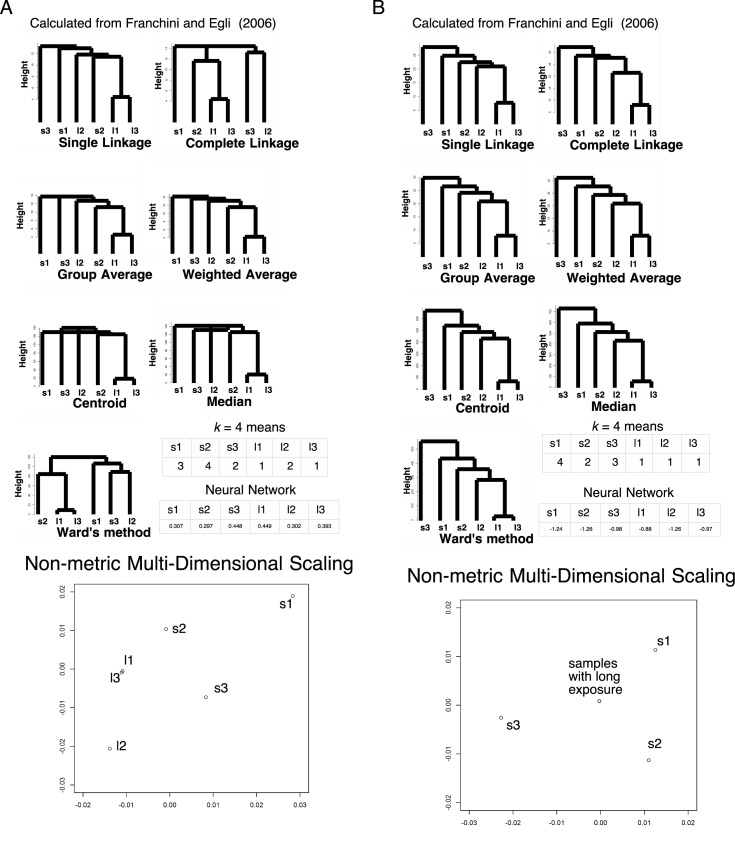
Fig 7. Clustering in the expression array data of Escherichia coli (N = 1109).
s1, s2, and s3: samples with short-term starvation for glucose in replicates 1 (GSM106337), 2 (GSM106338), and 3 (GSM106339), respectively; l1, l2, and l3: samples with long-term starvation for glucose in replicates 1 (GSM106340), 2 (GSM106341), and 3 (GSM106342), respectively. The numbers in the k-means table are the indices of the classified groups. The numbers in the neural network table are the cl factors, which represents the one-dimensional characteristics of the systems. The differences in cl values show dissimilarity of the samples. Please also see [18] and the Methods section for more detail. (A) 2induction factor values. (B) v values.

