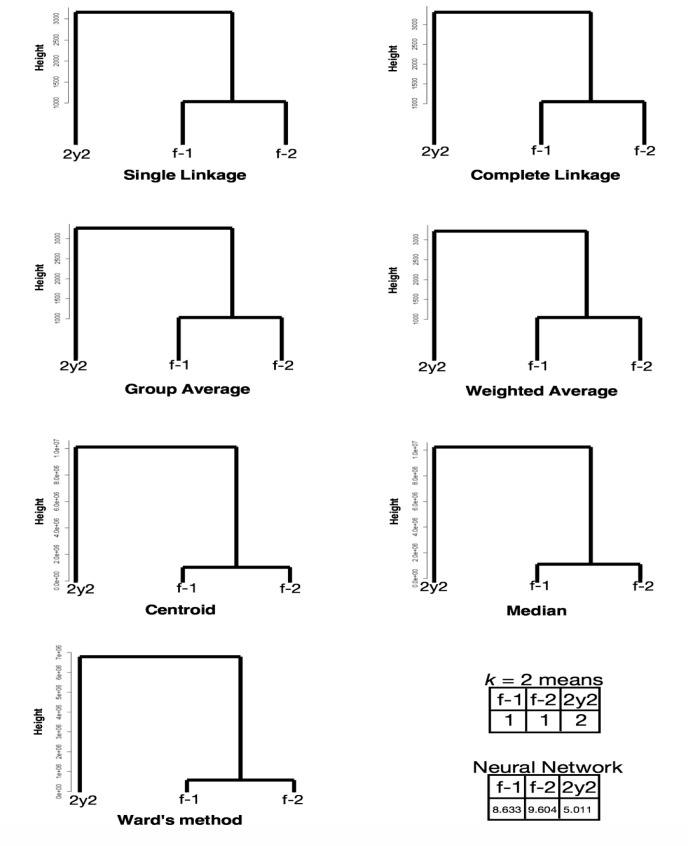
Fig 8. Clustering of newly invented v value sets of each protein in LC/MS of HEK-293 (N = 803).
f-1 and f-2: freshly prepared samples in replicates 1 and 2, respectively; 2y2: a sample preserved in liquid nitrogen storage according to the RIKEN protocol for approximately two years in replicate 2. The numbers in the k-means table are the indices of the classified groups. The numbers in the neural network table are the cl factors, which represents the one-dimensional characteristics of the systems. The differences in cl values show dissimilarity of the samples. Please also see the Methods section.

