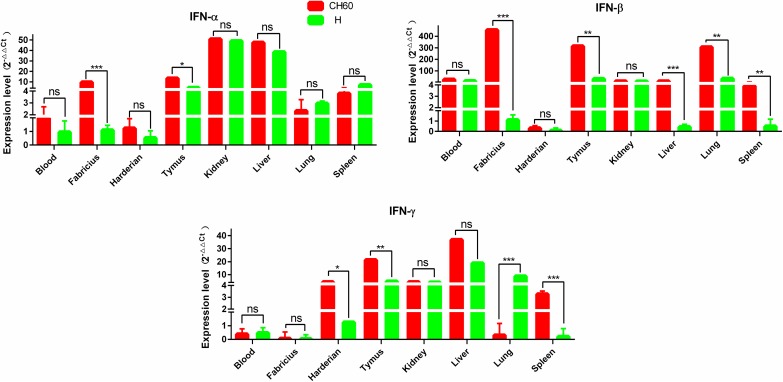
Fig 3. Expression patterns of interferons in different organs.
The relative expression level of IFN-α, IFN-β and IFN-γ were calculated using the 2-ΔΔCt method. The error bars represent standard errors of the mean. Statistically significant differences between the mean gene expression levels in different organs were determined by one-way ANOVA (P < 0.05). *P < 0.05, **P < 0.01 or ***P < 0.001 indicate the level of statistical significance of differences between different groups.

