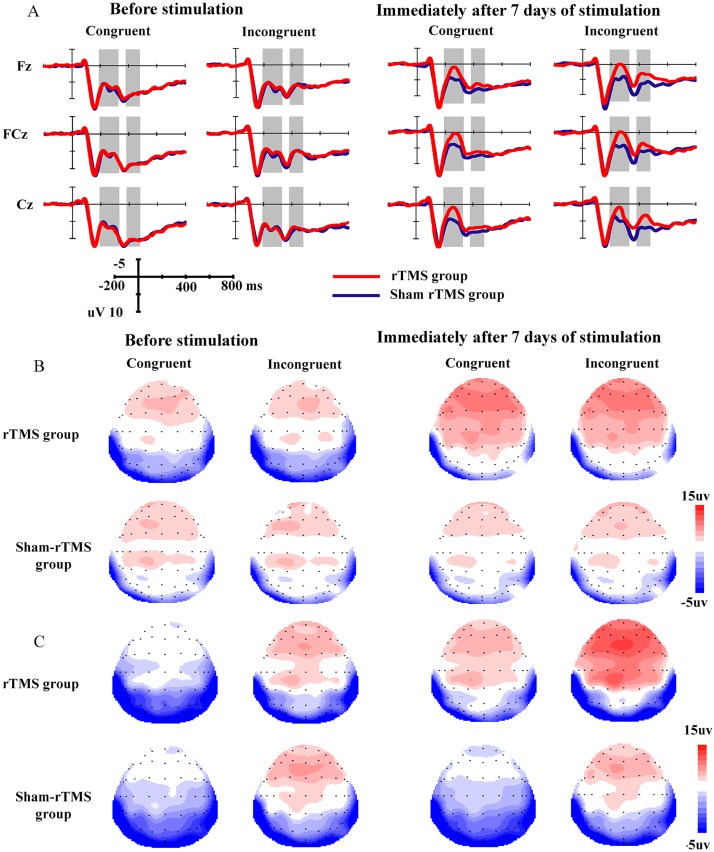
Fig 2. The grand-average N2 and N450 waveforms and their scalp distributions in the two groups.
A: The grand-average N2 and N450 waveforms under two conditions (congruent, incongruent) at two time points (T1, T2) in the rTMS group and sham rTMS group. The gray areas represent the time windows of the measured mean amplitudes of N2 (190–330 ms) and N450 (380–480 ms). B: The scalp distributions of N2. C: The scalp distributions of N450.

