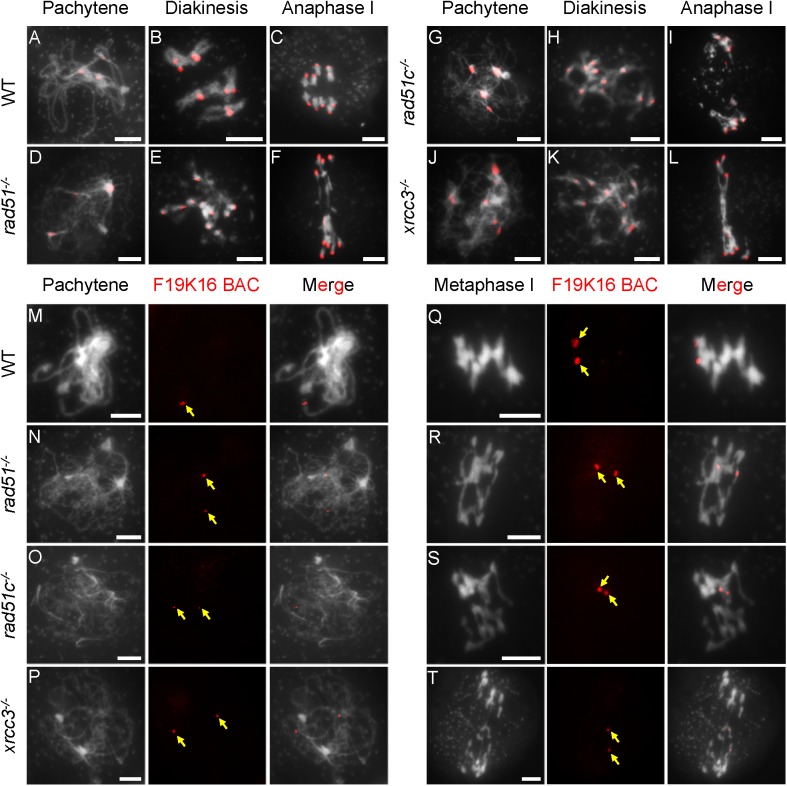
Fig 1. Fluorescence in situ hybridization (FISH) analysis of chromosome interactions in atrad51, atrad51c and atxrcc3 mutants.
(A-L) Chromosome morphologies of wild type (WT), atrad51, atrad51c and atxrcc3 mutants at pachytene, diakinesis and anaphase I. Centromeres appear as red dots. (M-P) WT pachytene chromosomes showing a single signal from the BAC-F19K16 probe and atrad51, atrad51c, and atxrcc3 chromosomes showing two signals from the same probe. (Q-S) Equal segregation of BAC-F19K16 signals at metaphase I in WT and unequal segregation in atrad51 and atrad51c mutants. (T) BAC-F19K16 signals located on atxrcc3 chromosome fragments at metaphase I. For FISH analysis of chromosomes using the BAC-F19K16 probe, the left panels show the chromosome morphology following staining with 6-diamidino-2-phenylindole (DAPI), the middle panels show the BAC-F19K16 signals (red dots) and the right panels merge the DAPI staining and BAC-F19K16 signals. Scale bar: 5 μm.

