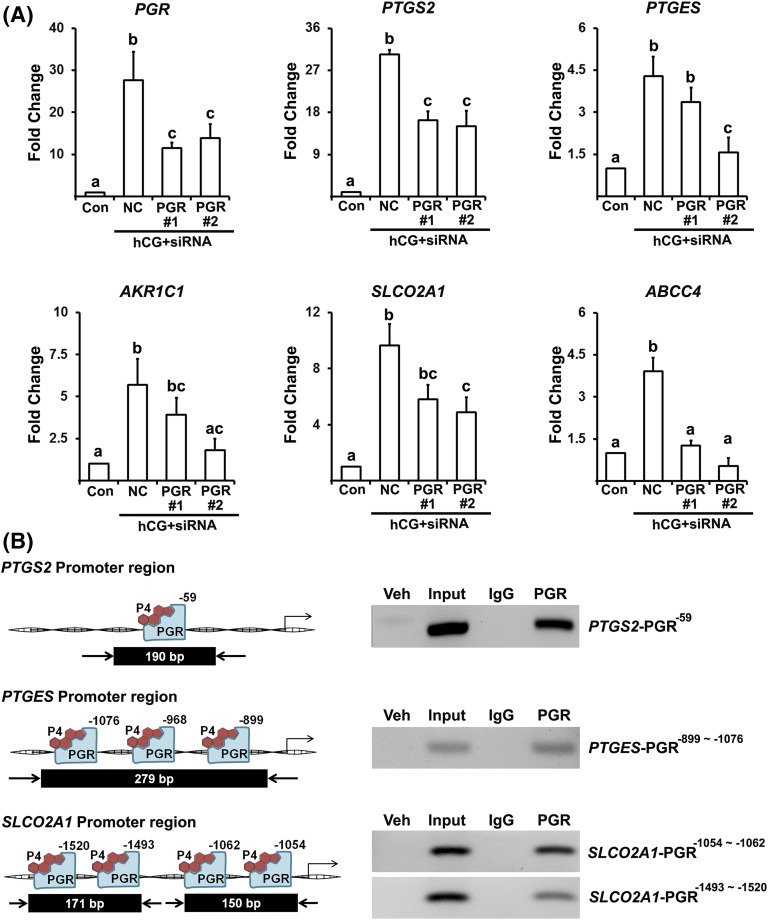
Figure 6.
PGR siRNA reduced the expression of PTG synthases and transporters and PGR binds to promoter regions of PTGS2, PTGES, and SLCO2A1. (A) Primary hGLCs were treated with or without hCG (1 IU/mL) in the presence of negative control (NC) siRNA and PGR siRNA (#1 and #2) for 10 hours. The levels of mRNA for PTG synthases (PTGS2, PTGES, and AKR1C1), transporters (SLCO2A1 and ABCC4) and PGR were measured by quantitative PCR. The levels of transcripts were normalized to RNA18S5 mRNA in each sample (n = 3 independent experiments). Bars with no common superscripts in each time point are significantly different (P < 0.05). (B) ChIP assay was performed using hGLC treated with hCG (1 IU/mL) for 12 hours. DNAs immunoprecipitated with PGR antibody or IgG and input DNA were analyzed using primer pairs specific to promoter regions of the PTGS2, PTGES, and SLCO2A1 gene and represented as arrows. Amplified DNA fragments containing PGR responsive elements are represented as a black box with the indicated PCR product size. Experiments were repeated three times, each with independent cultured cells.

