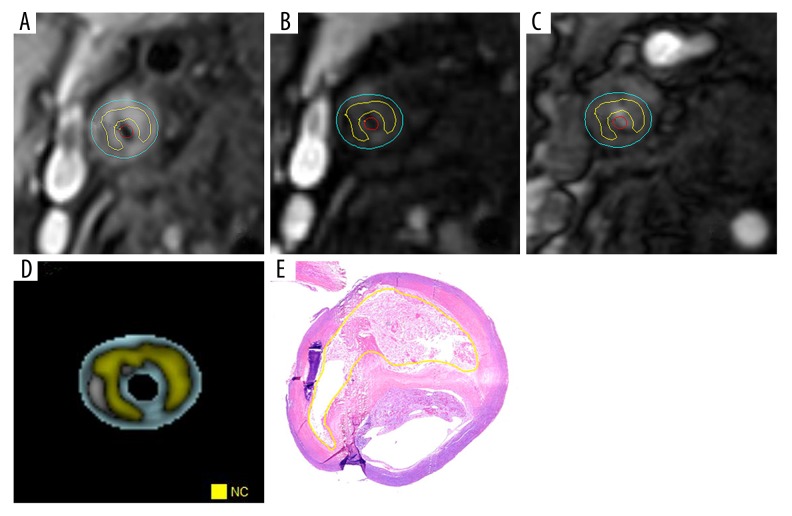
Figure 1.
Quantitative measurements of LRNC within carotid artery plaques. (A) T1WI image of lipid-rich necrotic core (LRNC; yellow line delineated area). (B) T2WI image of LRNC (yellow line delineated area). (C) 3DTOF image of LRNC (yellow line delineated area). (D) Composition analysis software MR-P merged image of carotid artery plaque, with yellow zone representing the LRNC. (E) Histological section of LRNC corresponding to MRI image layer, delineated by yellow line (H&E, ×20).

