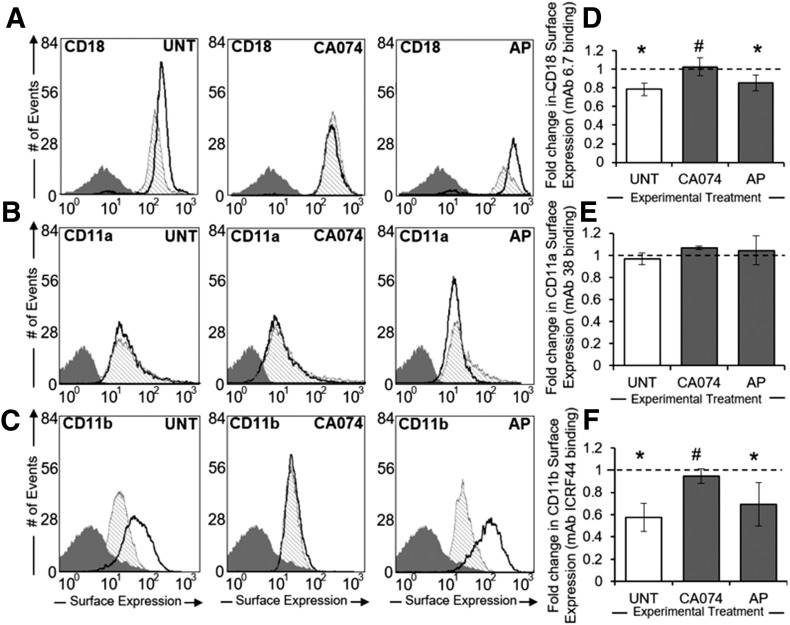
Figure 1. Selective cleavage of Mac1 by FSS-induced ctsB release.
(A–C) Representative flow cytometry histograms of intact CD18 (A), CD11a (B), and CD11b (C) integrin expression on the surface of neutrophil suspensions maintained under no-flow conditions (thick black line) or subjected to 5 dyn/cm2 shear stress (hatched shading) using a cone–plate viscometer. Negative (IgG) staining control is displayed in each plot (dark gray shading). Neutrophil suspensions were left UNT or treated with ctsB-specific inhibitor CA074 (50 µM) or serine inhibitor AP (5 μM). (D–F) Mean fluorescent intensities of sheared neutrophils were normalized to their respective no-flow controls and plotted as mean fold-change ± sd for CD18 (D), CD11a (E), and CD11b (F) integrins, based on fluorescent Ab binding to the neutrophil surface. n = 3 replicates in each group. *P < 0.05 compared with a hypothetical value of 1 (normalized control). #P < 0.05 compared with control.

