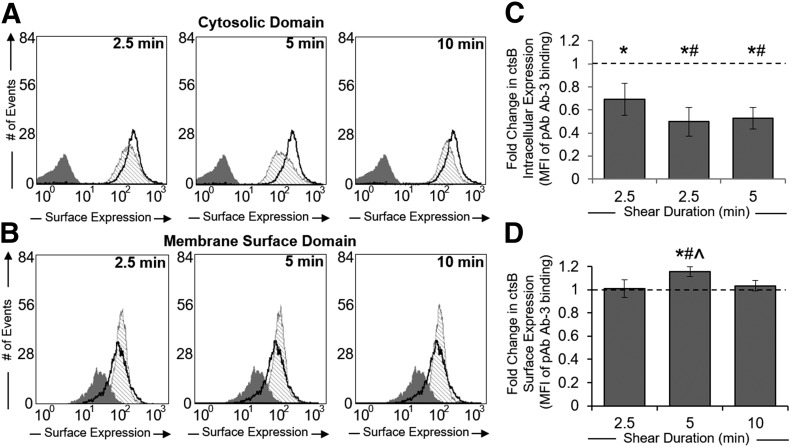
Figure 2. Time-dependent ctsB release in response to FSS exposure.
(A and B) Representative flow cytometry histograms of ctsB expression within the cytosolic domain (A) or membrane-surface domain (B) for neutrophil suspensions maintained under no-flow conditions (thick black line) or exposed to 5 dyn/cm2 shear stress (hatched shading) using a cone–plate viscometer. Negative (IgG) staining control is displayed in each plot (dark gray shading). Cells were permeabilized (A) or left UNT (B) to measure ctsB expression within the cytosolic or membrane surface domains. Shear duration was gradually increased (2.5, 5, and 10 min) to observe the time-dependent effects of shear. (C and D) Mean fluorescent intensities of sheared neutrophils were normalized to their respective no-flow controls and plotted as fold-change means ± sd for ctsB cytosolic (C) or membrane surface (D) expression, based on fluorescent Ab binding to ctsB. *P < 0.05 compared with a hypothetical value of 1 (normalized control). n = 3 replicates in each group. #P < 0.05 compared with 2.5 min shear exposure. ^P < 0.05 compared with 10 min shear exposure.

