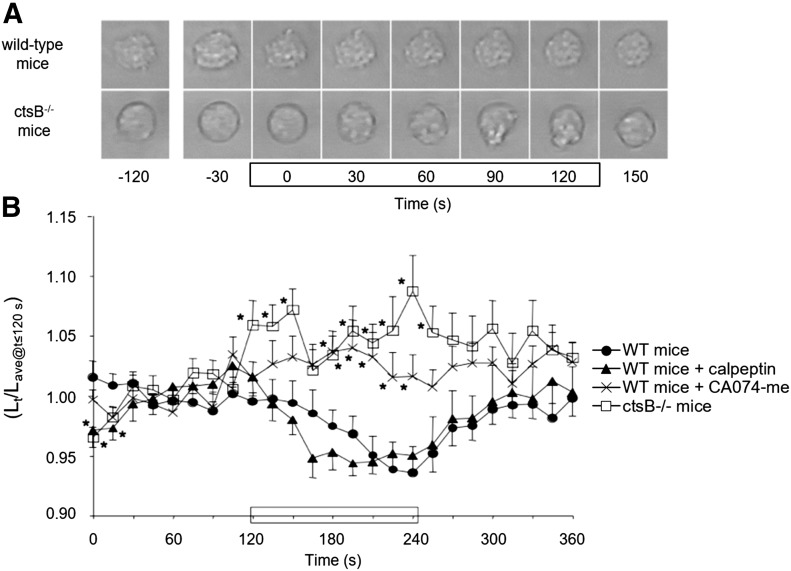
Figure 6. Link between ctsB deficiency and an impaired pseudopod retraction response to shear.
(A) Representative images of cells from either WT or ctsB−/− mice. Cells were exposed to FSS during the indicated (rectangle) 2-min period. (B) Time course of cell retraction by WT mice neutrophils migrating in the absence (solid circles) and presence of either calpeptin (solid triangles; a cathepsin G-specific inhibitor) or CA074-me (Xs; a ctsB-specific inhibitor), as well as by cells from ctsB−/− mice (open squares). Pseudopod retraction is represented by the instantaneous major length of the cell (Lt) normalized with the average major axis length (Lave) recorded for 0–120 s in each group. In each group, fluid shear (∼1.5 dyn/cm2) was applied for 120–240 s (black rectangle on x axis). n = ≥12 cells from either 4 WT mice or 7 ctsB−/− mice. *P < 0.05 compared with UNT cells at each time point using Student’s t test.

