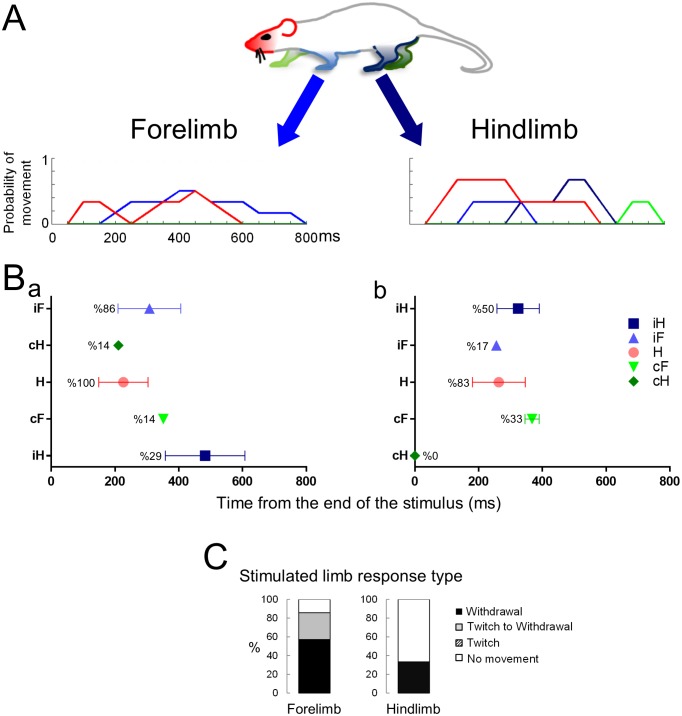
Figure 4. The response to a blunt stimulus when the animal is standing on four legs.
Movement histograms (A) and averaged first response scatter plots with the probability (%) of a movement (B) showing the movements evoked by stimuli to the forelimb (left panels) or hindlimb (right panels) paws. (C) Bar plots representing the proportion of withdrawals (■), twitches (■), or no movements (□) of the stimulated limb. Color codes for the head and the limbs as in Figure 2. H– Head; iF- ipsilateral forelimb; iH– ipsilateral hindlimb; cF– contralateral forelimb; cH– contralateral hindlimb.

