. 2017 Jun 5;6:e23244. doi: 10.7554/eLife.23244

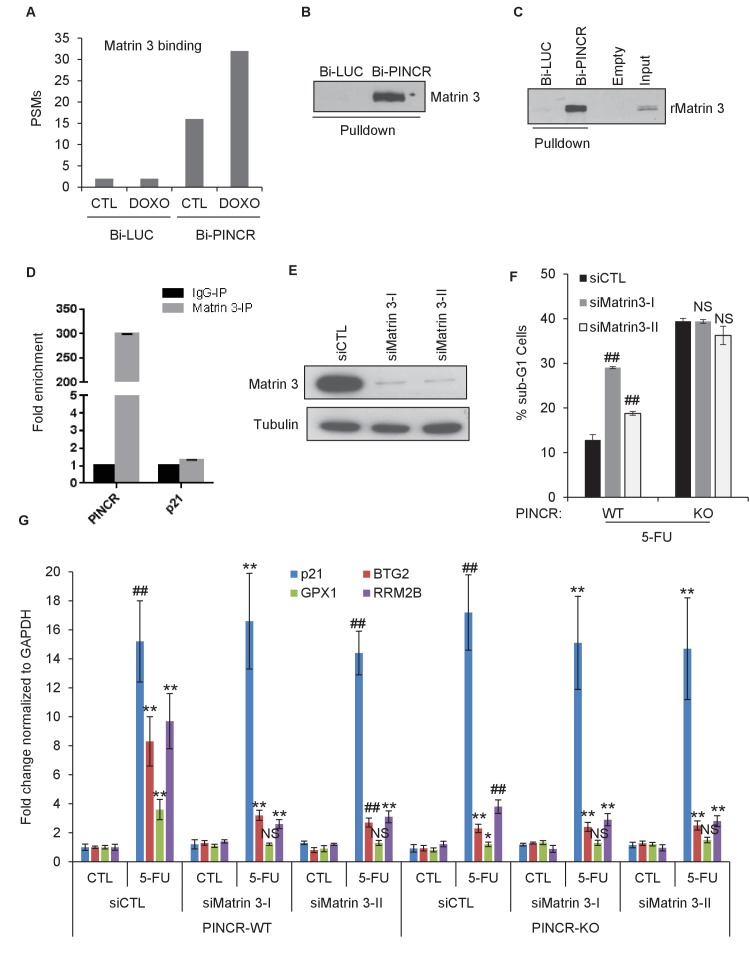
Figure 5. Matrin 3 binds to PINCR and functions as a downstream effector of PINCR.

(A) Peptide spectrum matches (PSMs) corresponding to Matrin 3 in the Bi-LUC and Bi-PINCR pulldowns from mass spectrometry analysis. (B, C) Streptavidin pulldowns followed by immunoblotting was performed following incubation of Bi-LUC and Bi-PINCR RNA with DOXO-treated HCT116 nuclear extracts (B) or recombinant Matrin 3 (rMatrin 3) (C). (D) Specific enrichment of PINCR in the Matrin 3 IPs was assessed by qRT-PCR from 24 hr 5-FU-treated formaldehyde cross-linked HCT116 cells. p21 mRNA was used as negative control. (E) PINCR-WT cells were transfected with CTL or two independent Matrin 3 siRNAs (I and II) for 48 hr and Matrin 3 knockdown was measured by immunoblotting. (F) PINCR-WT and PINCR-KO cells were transfected with CTL or Matrin 3 siRNAs and after 48 hr the cells were untreated or treated with 5-FU for 48 hr. The effect on the sub-G1 population was assessed by PI staining followed by FACS. (G) PINCR-WT and PINCR-KO cells were transfected with CTL or Matrin 3 siRNAs for 48 hr; transfected cells were left untreated or treated with 5-FU for 24 hr and qRT-PCR was performed. Error bars in D, F and G represent SD from three independent experiments. *p<0.05; #p<0.01; **p<0.005.

DOI: http://dx.doi.org/10.7554/eLife.23244.038

Figure 5—source data 1. Matrin 3 immunoblot for Figure 5B, C and E.
elife-23244-fig5-data1.docx (176.5KB, docx)
DOI: 10.7554/eLife.23244.039

Figure 5.

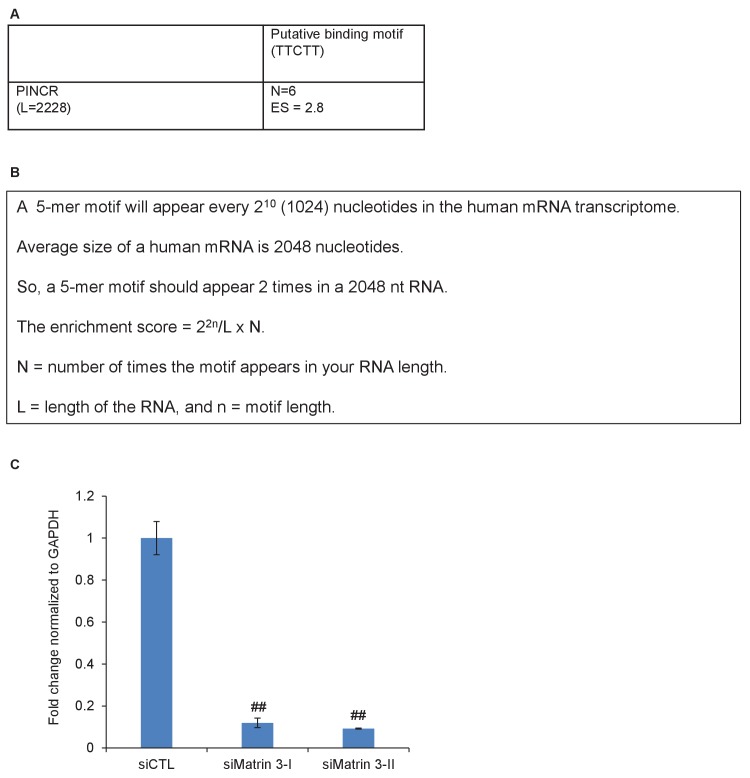
Figure 5—figure supplement 1. Matrin 3 motifs in PINCR RNA.

Figure 5—figure supplement 1.

(A, B) Putative Matrin 3 binding motif in PINCR RNA. (A) ‘N’ represents the number of times the motif appears in the PINCR RNA. ‘ES’ represents the enrichment score calculated as shown in ‘B’. (C) HCT116 cells were reverse transfected with a control siRNA (siCTL) or siRNAs targeting Matrin 3 (siMatrin 3-I and siMatrin 3-II) for 48 hr and the extent of Matrin 3 knockdown was measured by qRT-PCR for Matrin 3 normalized to GADPH. Error bars represent SD from three independent experiments. ##p<0.001.
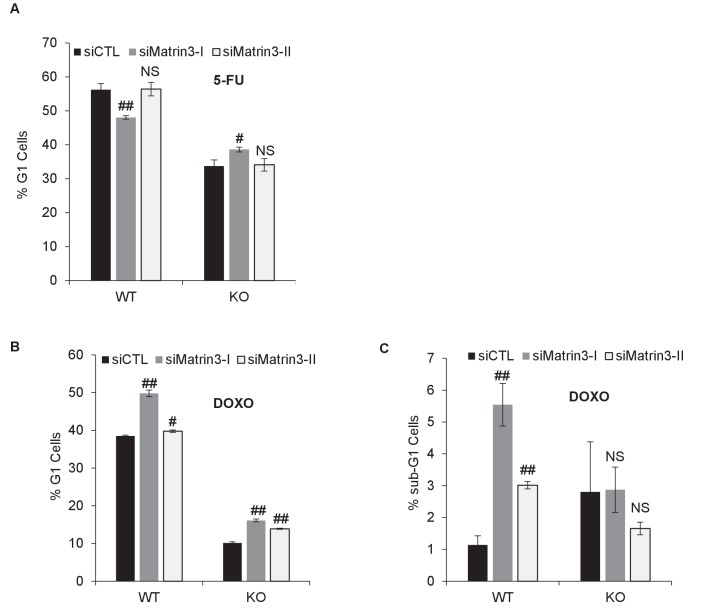
Figure 5—figure supplement 2. Cell cycle analysis after Matrin 3 knockdown.

Figure 5—figure supplement 2.

PINCR-WT and PINCR-KO HCT116 cells were reverse transfected with a control siRNA (siCTL) or siRNAs targeting Matrin 3 (siMatrin 3-I and siMatrin 3-II) for 48 hr. Transfected cells were left untreated or treated with DOXO or 5-FU for 48 hr. The effect on G1 arrest and apoptosis was examined by PI-staining and FACS analysis. Shown are the results from three independent experiments after 5-FU treatment (A) or DOXO treatment (B, C). Error bars represent SD from three independent experiments. #p<0.01, ##p<0.001.
Figure 5—figure supplement 3. Raw cell cycle profiles from a representative experiment for Figure 5F and Figure 5—figure supplement 3 are shown.

Figure 5—figure supplement 3.

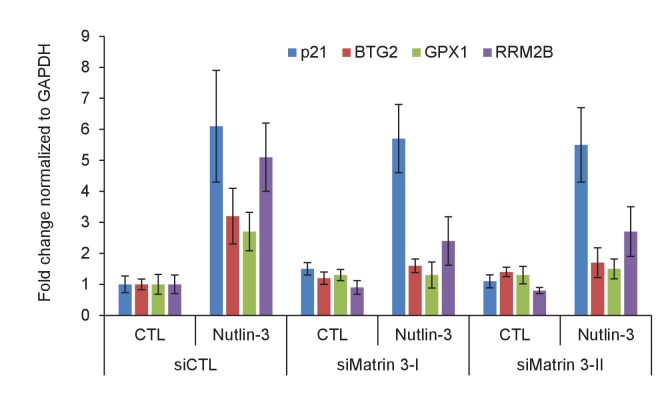
Figure 5—figure supplement 4. Matrin 3 regulates the induction of PINCR targets upon p53 activation by Nutlin-3.

Figure 5—figure supplement 4.

PINCR-WT HCT116 cells were reverse transfected with CTL siRNA or Matrin-3 siRNAs for 48 hr and then treated with Nutlin-3 for 24 hr. The expression of PINCR targets and the negative control p21, was assessed by qRT-PCR. Error bars represent SD from two independent experiments.
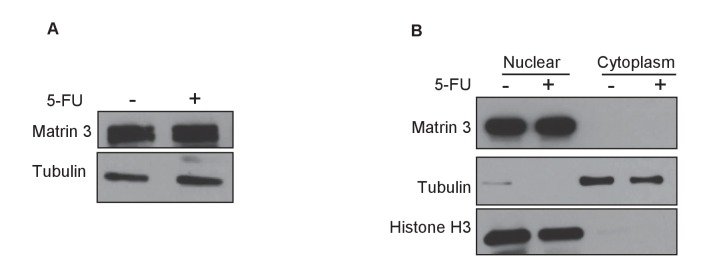
Figure 5—figure supplement 5. Matrin 3 protein level and subcellular localization is not altered after DNA damage.

Figure 5—figure supplement 5.

HCT116 cells were untreated or treated with 5-FU for 24 hr and immunoblotting for Matrin 3 was performed from whole cell extracts (A) or nuclear and cytoplasmic extracts (B). Tubulin was used as loading control for (A). For (B) Histone H3 was used as nuclear marker and Tubulin was used as cytoplasmic marker.
Figure 5—figure supplement 5—source data 1. Matrin 3 immunoblot for Figure 5—figure supplement 5A and B.
DOI: 10.7554/eLife.23244.045