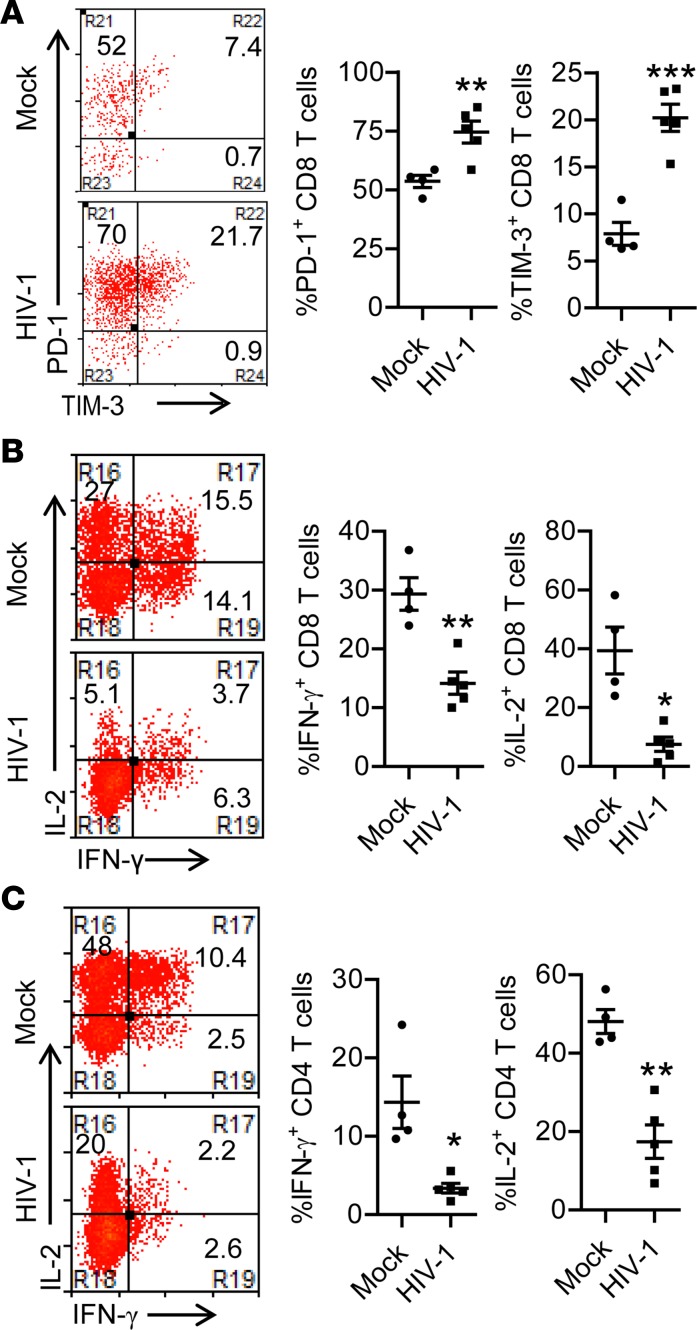
Figure 2. Persistent HIV-1 infection in humanized mice leads to impaired T cell function.
Humanized mice were infected with HIV-1 and terminated at 10.5 weeks postinfection (wpi). (A) Representative dot plots and summarized data show the percentage PD-1+ and TIM-3+ of CD8+ T cells in spleens. (B and C) At 10.5 wpi, splenocytes were stimulated ex vivo with PMA/ionomycin for 4 hours followed by intracellular cytokine staining. (B) Representative dot plots (of cells gated on human CD45+CD3+CD8+) and summarized data show the percentages of IFN-γ–producing and IL-2–producing CD8+ T cells. (C) Representative dot plots (of cells gated on human CD45+CD3+CD4+) and summarized data show the percentages of IFN-γ–producing and IL-2–producing CD4+ T cells. Shown are representative data (mock, n = 4; HIV-1, n = 5) of 4 independent experiments (mock, n = 12; HIV-1, n = 18 in total) with mean values ± SEM. *P < 0.05, **P < 0.01, ***P < 0.001 by unpaired, 2-tailed Student’s t test.

