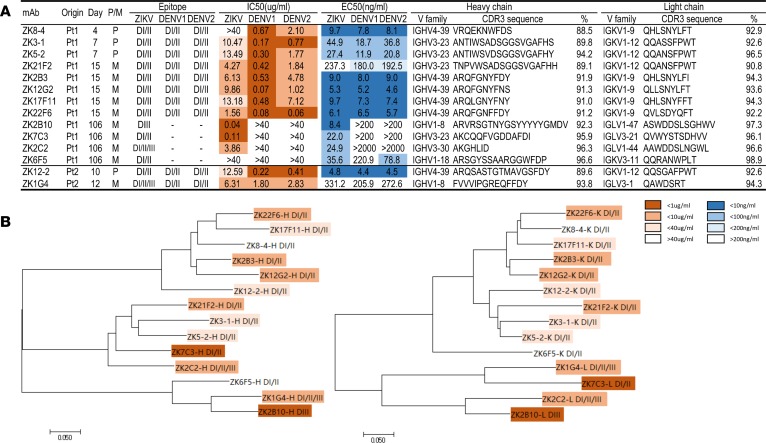
Figure 4. Summary of isolated mAbs and phylogenetic analysis.
(A) Antibodies were listed accordingly to the sampling time points from the patients together with the type of B cells originally derived from, P for plasmablast and M for memory. Epitope specificity was determined by staining with DI/II– and DIII–expressing yeast clones from ZIKV, DENV1 and DENV2. IC50 represents the half-maximal inhibitory concentrations in the plaque neutralization assay, whereas EC50 represents the half-maximal effective concentrations in ELISA binding assay, and both of which are presented in heatmap format for differential activities. Only the CDR3 regions of heavy and light variable chain are shown together with their family names and percent similarity with the corresponding germline ancestor sequence. (B) Unrooted neighbor-joining tree depicting the relationship of isolated mAbs; left panel for the heavy chain and right panel for the light chain variable region. The branch length is drawn to scale so that the relatedness between different amino acid sequences can be readily assessed. Individual sequences are named at the tip of the branches, and their epitope specificity and neutralizing potency are indicated as in the heatmap.

